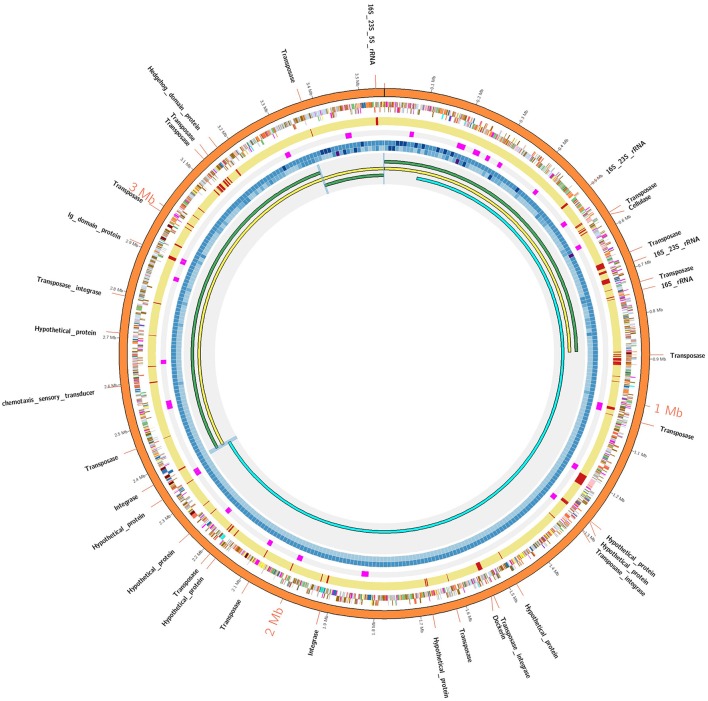
Figure 1.
AD2 genome assembly comparisons. The outermost orange colored circle corresponds to finished genome assembly. The next two circles show genes on positive and negative strands and using color coded by standards for COG categories. The next yellow colored circle corresponds to Illumina assembly and gaps within Illumina assembly are denoted by red strokes. The next circle denotes the strong positional preference marked in pink color. The next two concentric circles denote the sequence coverage for Illumina and PacBio technologies respectively as heatmap (lowest: light blue, highest: dark blue). The innermost circle: AD2_SC1 (yellow) was generated by super assembly of draft contigs (green). AD2_HC1 (sky blue) share 780 kb overlap with AD2_SC1. Blue-highlighted region denotes sequence overlaps validated using PCR/Sanger approach. A detailed Illustration is provided in Figure S1.

