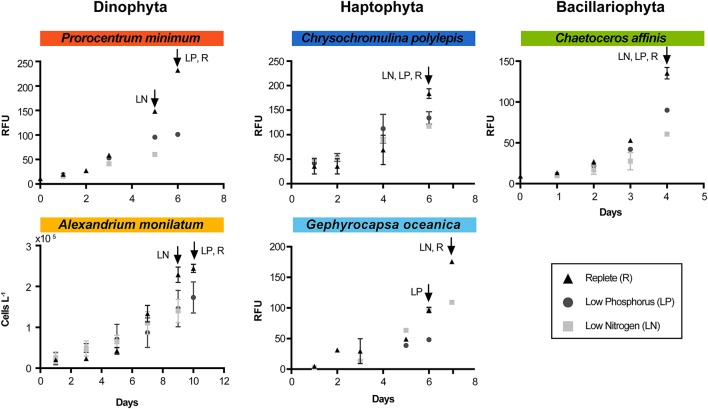
Figure 1.
Growth curves for each species and each treatment during the experiment. Arrows indicate time of harvest for each treatment (designated by treatment abbreviation). RFU indicates “relative fluorescence unit.” Triangles represent the replete condition (control), squares represent the low N, and circles represent the low P. Error bars are the standard error of the mean (n = 3). For A. monilatum, growth curves were determined by cell counts due to difficulty in measuring reliable in vivo fluorescence.

