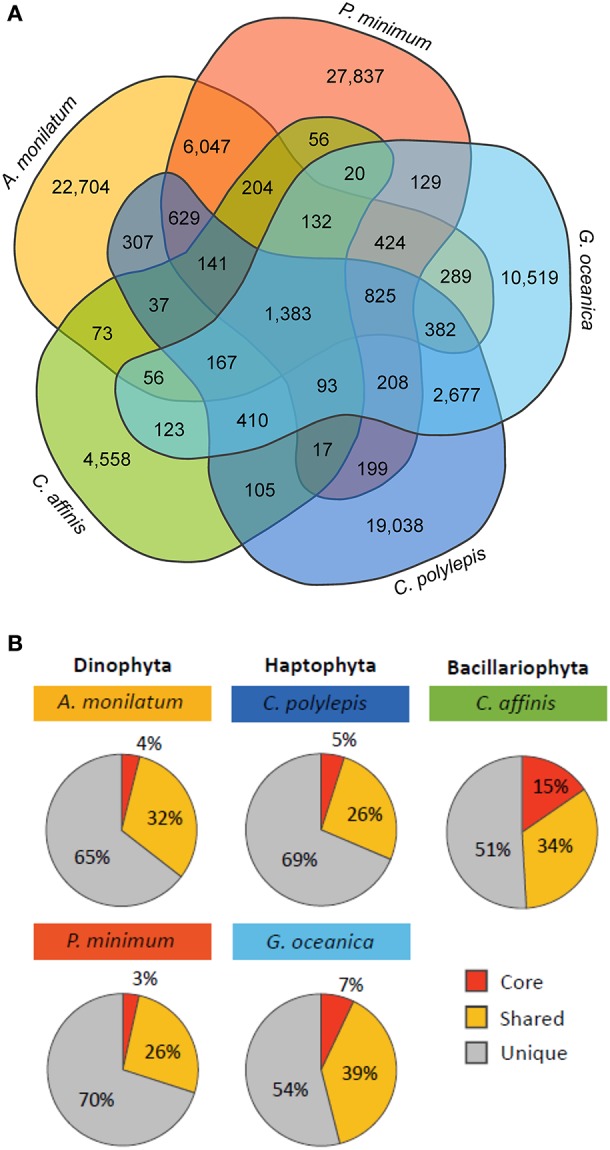
Figure 4.

(A) Venn diagram displaying the number of orthologous groups shared between the five species and (B) the percent of total orthologous groups for each species that are core (shared by all species), shared (shared with one to three species), and unique (only found in that species).
