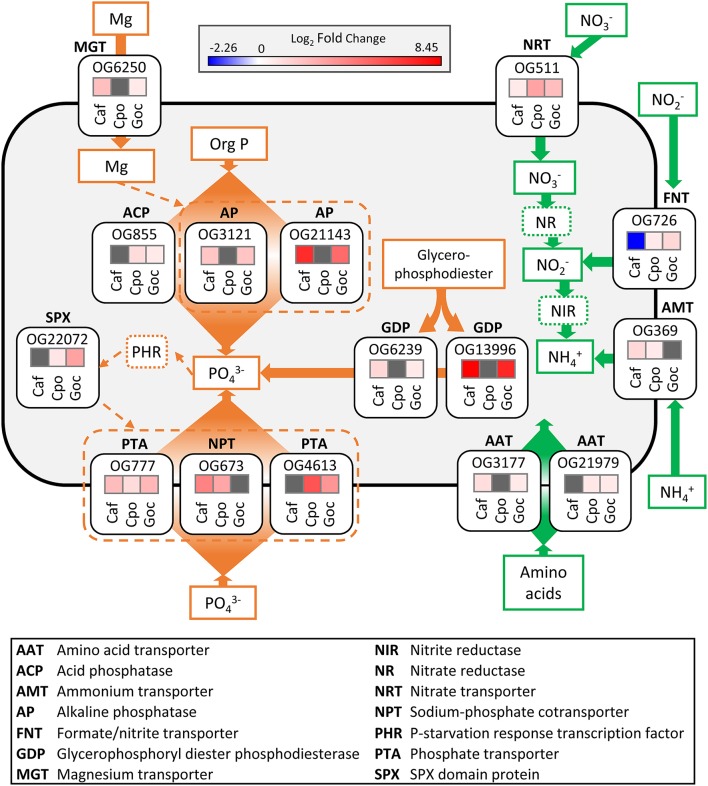
Figure 6.
Schematic cell model depicting the significant (ASC, post-p > 0.95 of fold change > 2) ortholog responses associated with conserved nitrogen stress (green) and phosphorus stress (orange) responses in each species. Solid lines and arrows represent known pathways while dashed lines and arrows indicate potential pathways. For log2-fold change heat maps (treatment vs. replete), red colors denote increase in transcript abundance, blue colors denote decrease in transcript abundance, and gray denotes no differential expression. Orthologous group ID is above each fold change heat map box. The dinoflagellates were not included in this analysis. Caf, C. affinis; Cpo, C. polylepis; Goc, G. oceanica.

