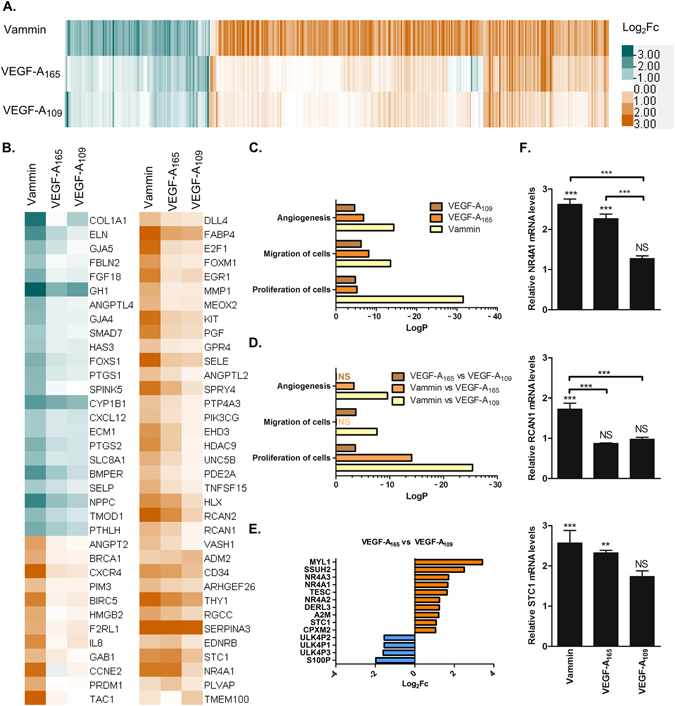
Figure 5.

(A) Heatmap of fold changes (Log2) in gene expression levels between vectors encoding the tested factors and the AdCMV control vector. (B) Heatmap of fold changed (Log2) of the angiogenesis associated genes identified in the gene ontology analysis. (C and D). Gene ontology analysis using the Ingenuity Pathway Analysis: The top 3 most significantly enriched physiological functions are presented. (E) The genes differentially expressed between VEGF-A165 and VEGF-A109. F. qRT-PCR analysis of the expression of NR4A1, RCAN1 and STC1 in human dermal blood endothelial cells. The data is presented as mean ± SEM. **P < 0.01, ***P < 0.001.
