
Figure 1.
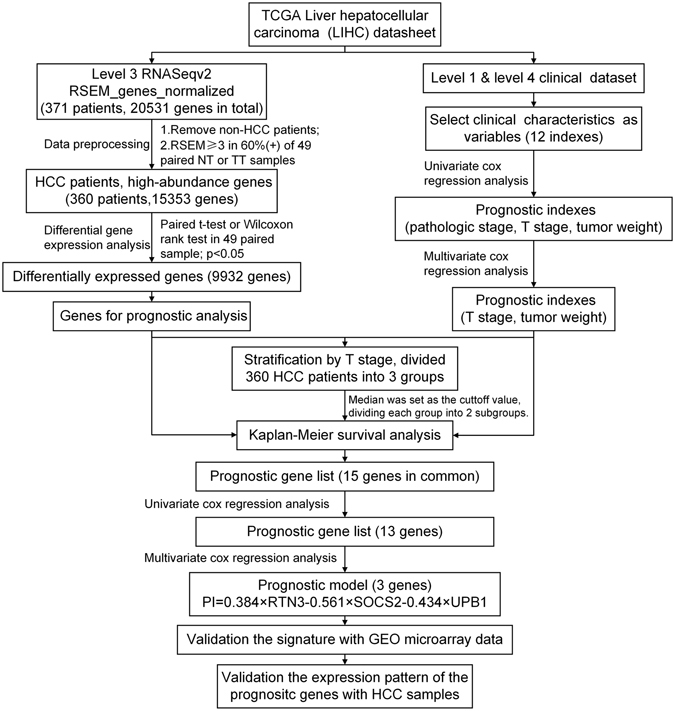
Flowchart describing the process used to generate and validate the prognostic signature in the analysis. The level 3 RNAseqv2 RSEM_genes_normalized files and clinical datasets were downloaded from TCGA. 10 non-HCC patients were ruled out. The gene abundance was filtered by requiring the RSEM normalized count to be ≥3 in ≥60% of 49 paired tumor tissues or nontumor tissues. The remaining 15353 genes were recruited for the differential expression analysis with paired t-test or Wilcoxon signed-rank test. The resulting 9932 differentially expressed genes were candidates for prognostic analysis. Clinical characteristics were selected as variables for univariate and cox regression analysis. T stage and tumor weight were found to be statistically significant in both univariate and multivariate cox regression analysis. 360 patients were stratified by T stage, divided into 3 groups. Kaplan-Meier survival analysis was performed in every group with the median as the cutoff value. We obtained 15 common genes in three groups, and further narrowed this gene list with univariate and cox regression analysis and built a prognostic model that included 3 genes: UPB1, SOCS2 and RTN3. This model was used to calculate risk scores for two independent expression microarrays retrieved from GEO. Finally, we validated the expression pattern of UPB1, SOCS2 and RTN3 by western blot and immunohistochemistry with our HCC samples.