
Figure 2.
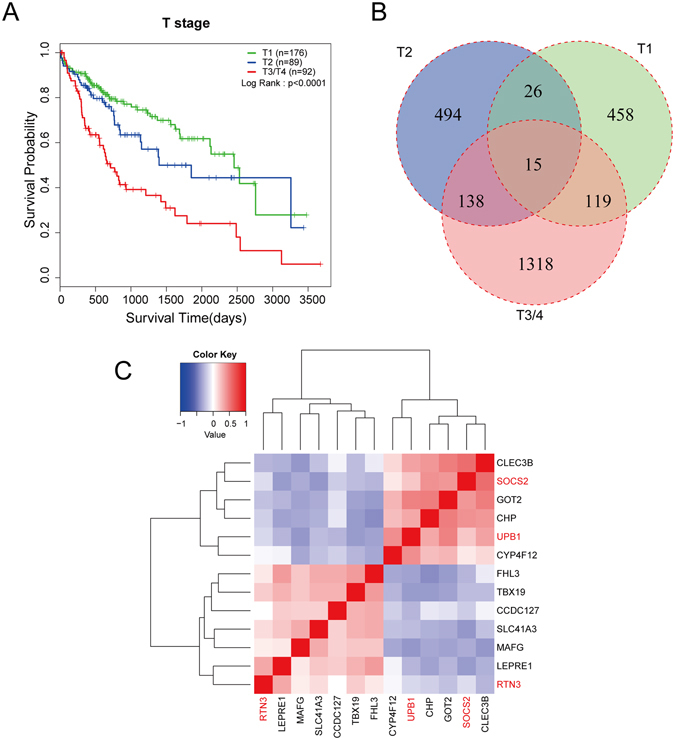
Identification of prognostic genes with T stage stratification. (A) Kaplan-Meier curve for overall survival in HCC patients with different T stages from TCGA LIHC dataset. Patients were divided into 3 groups according to the T stages (T1, n = 176; T2, n = 89; T3 and T4, n = 92). Advanced T stage is a significant factor for poor prognosis (p < 0.0001, log-rank test). (B) All HCC patients were divided into three groups based on the T stages, and Kaplan-Meier survival analysis was performed in each group separately. Two subgroup were separated on the basis of the median expression level of each gene. 617 survival-related genes were obtained from T1 group, and 672 genes from T2 group, 1590 genes from T3/4 group. 15 common genes were found in different groups. (C) Cluster analysis of the 13 survival related genes based on the spearman correlation coefficient. The color in the heatmap represents spearman correlation coefficient. Red indicates positive correlation, and blue indicates negative correlation. 13 genes were clustered into 4 clusters, and RTN3, SOCS2, UPB1 (marked in red) were in different groups.