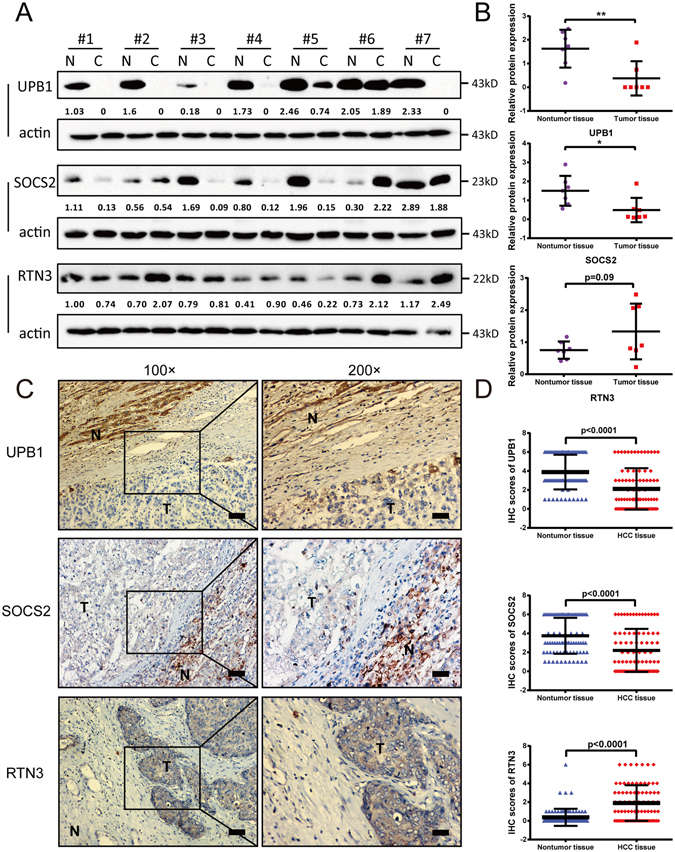
Figure 4.

Validation the expression pattern of prognostic genes in HCC samples. (A) Western blot analysis of UPB1 (upper panel), SOCS2 (middle panel), and RTN3 (lower panel) in 7 paired normal and tumor tissue samples. (B) Western blot quantitative densitometry of the UPB1, SOCS2, and RTN3 relative expressions. Proteins was quantified and normalized to β-actin. Statistical analysis was done using Wilcoxon rank test. Data are expressed as mean values ± SD. *p < 0.05, **p < 0.01. (C) Representative images from immunohistochemistry (IHC) staining of UPB1 (upper panel), SOCS2 (middle panel), and RTN3 (lower panel) in 82 normal tissues and paired HCC tissues. Left panel: 100 × magnifications; right panel: 200 × magnifications. Bars = 100 μm. (D) Statistical analyses of the average IHC scores of UPB1 (upper panel), SOCS2 (middle panel), and RTN3 (lower panel). Statistical analysis was done using Wilcoxon rank test. Data are expressed as mean values ± SD.
