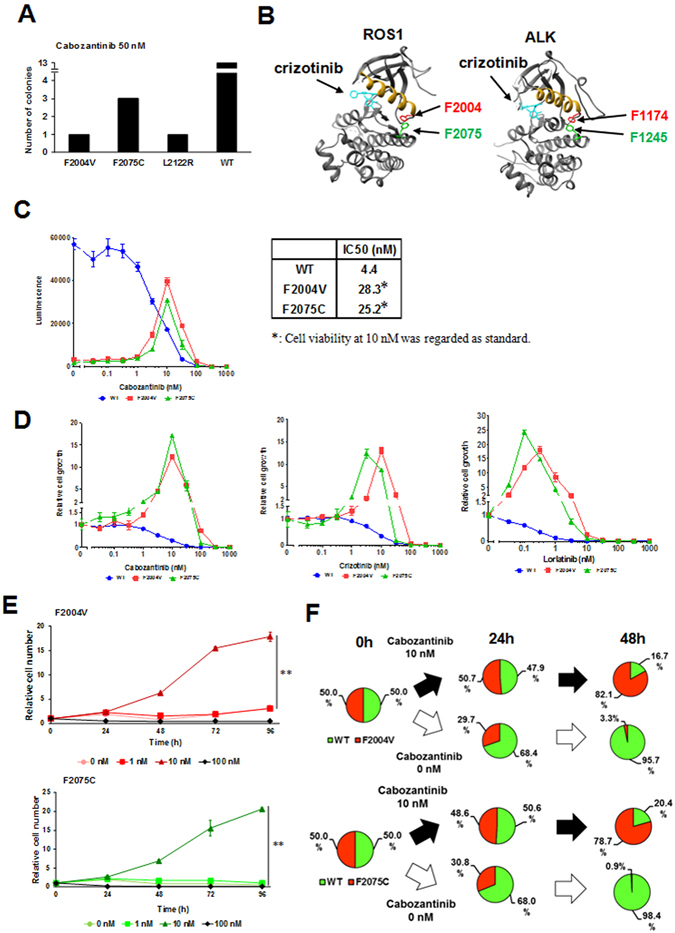
Figure 1.

Identification of cabozantinib-resistant mutations by ENU mutagenesis screening and addiction to ROS1-TKIs in Ba/F3 cells expressing F2004V- or F2075C-mutated CD74-ROS1. (A) The number of clones harbouring ROS1 kinase domain mutations found by ENU mutagenesis screening. (B) Three-dimensional mapping identifying ROS1 mutations based on the crystal structure of ROS1 (left: PDB 3ZBF) or ALK (right: PDB 2XP2) kinase domain in the presence of crizotinib. Mutated residues are shown in red and green in the ROS1 kinase domain and the correspondingly kinase domain. The alpha-C helix motif is depicted in yellow. Figures were drawn using UCSF Chimera software. (C) Sensitivity of Ba/F3 cells expressing wild-type (WT), or F2004V- or F2075C-mutated CD74-ROS1 to cabozantinib, shown by luminescence intensity (left). Calculated IC50 values (nM) of each cell line for cabozantinib are shown (right). Each cell line was treated with the indicated dose ranges of inhibitors for 72 h, then cell viability was measured by the CellTiter-Glo assay. (D) Sensitivity to cabozantinib (left: relative indication of Fig. 1C), crizotinib (middle) or lorlatinib (right) of Ba/F3 cells expressing wild-type CD74-ROS, or F2004V- or F2075C-mutated CD74-ROS1. Each cell line was treated with the indicated dose ranges of inhibitors for 72 h, then cell viability was measured by the CellTiter-Glo assay. Each value was normalised with the value from untreated cells. (E) Cell growth of F2004V- (top) or F2075C- (bottom) mutated cells with each dose of cabozantinib was measured by the CellTiter-Glo assay. Relative cell numbers were indicated by normalizing viability of each cell line with corresponding values at 0 h. Statistical significance was calculated by a t test, and ** indicates p < 0.001. (F) The dominant populations of wild-type CD74-ROS1, F2004V- (top), or F2075C- (bottom) mutated cells in the presence of 0 or 10 nM cabozantinib for 0, 24 or 48 h, analysed by flow cytometry (dot plots are shown in Supplementary Fig. S2). F2004V- or F2075C-mutated cells were stained with red (PKH26) and wild-type CD74-ROS1 cells with green (PKH67) fluorescent dye.
