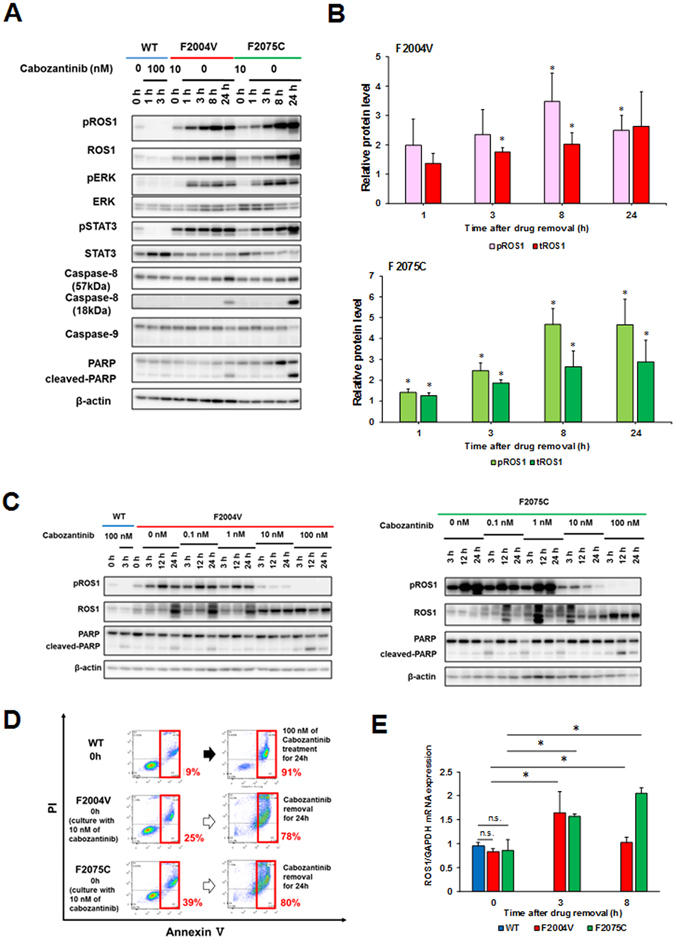
Figure 2.

Increased ROS1 activity after removal of ROS1-TKI induces apoptosis. (A,C) Immunoblotting for F2004V- or F2075C-mutated cells without (A) or with cabozantinib at the indicated concentrations (C), or wild-type CD74-ROS1 cells treated with 100 nM of cabozantinib. Cell lysates were immunoblotted to detect the indicated proteins. (B) The graph indicates protein levels of total or phospho-ROS1 normalised with β-actin. The value at each time point is compared with F2004V-(top) or F2075C- (bottom) mutated cells in the initial state (0 h, in the presence of 10 nM cabozantinib); values are shown as mean ± standard deviation (SD) of three independent experiments (including the values of Fig. 2A). Statistical significance was calculated by a t test; * indicates p < 0.05 (compared with values at 0 h). (D) Apoptosis assay by flow cytometry for 100 nM cabozantinib-treated wild-type CD74-ROS1 cells and F2004V- or F2075C-mutated cells after removal of cabozantinib for 24 hours. The percentage of cells undergoing apoptosis is shown in red. (E) Expression levels of ROS1 or GAPDH mRNA in wild-type CD74-ROS1, F2004V- or F2075C-mutated cells were quantified using qRT-PCR. The graph indicates relative mRNA expression levels of each ROS1 that was normalised with GAPDH. Each value is shown as mean ± SD of three experiments. Statistical significance was calculated by a t test; * indicates p < 0.05 and n.s., p ≥ 0.05. Uncropped blots are presented in Supplementary Fig. S11.
