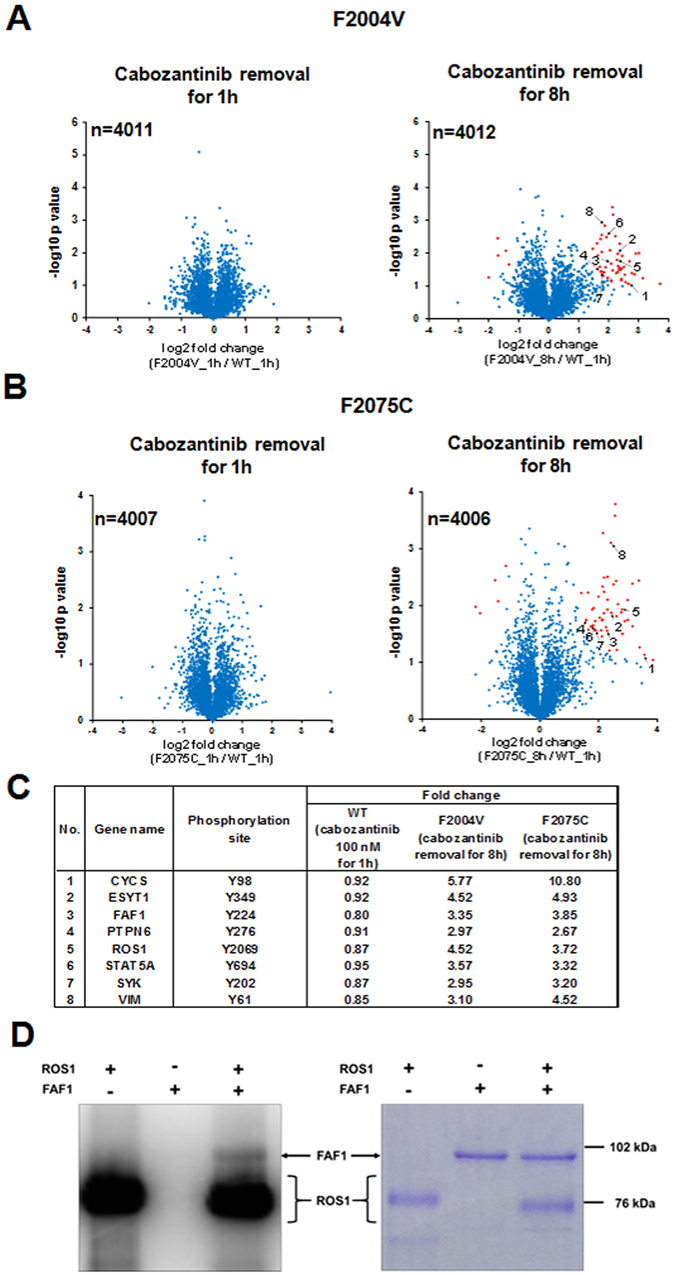
Figure 5.

Identification of phosphoproteins phosphorylated by excessive ROS1 signaling. (A,B) Volcano plot indicates log2-fold-change in values (horizontal axis) of phosphopeptides in F2004V- or F2075C-mutated cells without cabozantinib and cabozantinib-treated (100 nM) wild-type CD74-ROS1 cells, against the −log10 p value (vertical axis). These plots indicate the log2 fold-change between upregulated or downregulated phosphopeptides in F2004V- (A) or F2075C- (B) mutated cells by cabozantinib removal (F2004V or F2075C cells without/with 10 nM cabozantinib, respectively) and upregulated or downregulated phosphopeptides in wild-type CD74-ROS1 cell (untreated/cabozantinib-treated). Each plot is based on the mean fold-change of value and the p value of two independent experiments. Plots which passed the 0.05-Benjamini-Hochberg-false discovery rate threshold are shown in red. (C) List of representative common phosphopeptides which were significantly upregulated in the F2004V- or F2075C-mutated cells after removal of cabozantinib. (D) Coomassie brilliant blue-stained gel (right) and autoradiography (left) of human ROS1 and FAF1 proteins electrophoresed with [gamma-32P] ATP. Uncropped gel and autoradiograph are presented in Supplementary Fig. S11.
