
Figure 6.
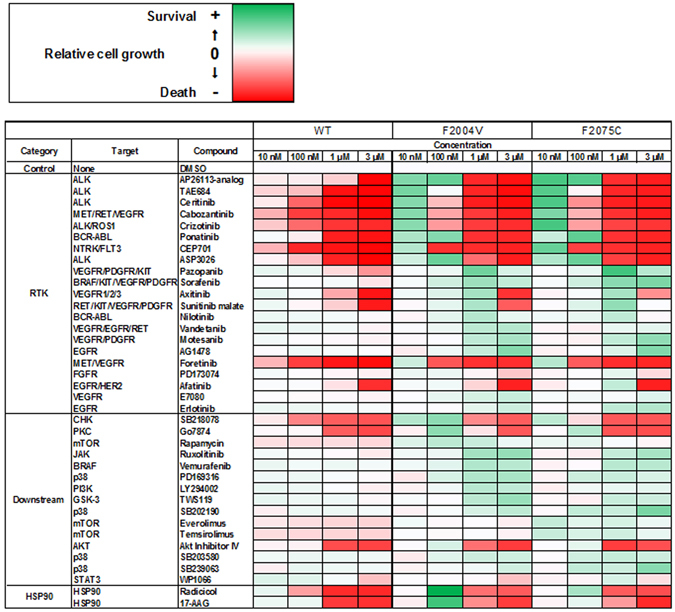
High-throughput inhibitor screening for Ba/F3 cells expressing wild-type CD74-ROS1, F2004V-, or F2075C-mutated CD74-ROS1. Representative data showing cell growth of wild-type CD74-ROS1 (WT), F2004V- or F2075C-mutated cells with treatment by each listed compound with DMSO treatment as control are shown in a heat map (all screening data and detailed values are shown in Supplementary Fig. S7). Red indicates that relative cell growth is suppressed and green that relative cell growth is enhanced compared with DMSO treatment. Cells were treated with 10, 100 nM, 1 or 3 μM of the indicated compounds for 72 h, then cell viability was measured by the CellTiter-Glo assay.