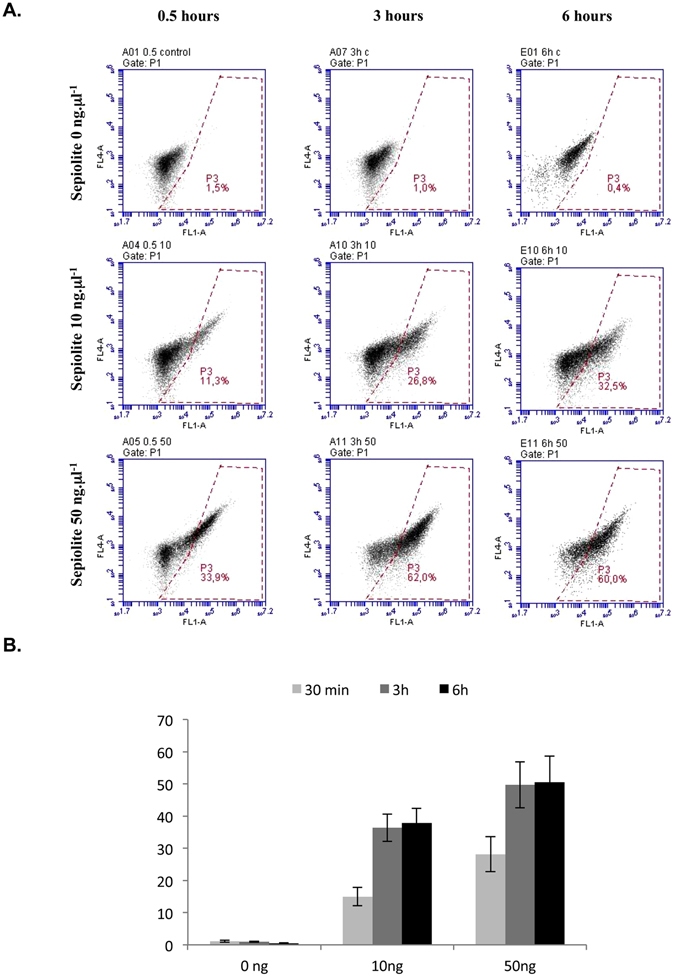
Figure 2.

FACS analysis of sepiolite interaction with V79 cells. (A) FACS analysis, 0.5, 3 and 6 hours after the addition of sepiolite into V79 cells at different concentrations (0 ng·μL−1, 10 ng·μL−1, and 50 ng·μL−1). The zone P3 corresponds to green fluorescent cells (channel FL1A, 530 nm) from the presence of sepiolite into the cell. 10 000 cells were counted in all experiments. (B) Quantification of sepiolite/cell interactions. Values represent the mean +/− SEM of 6 independent experiments.
