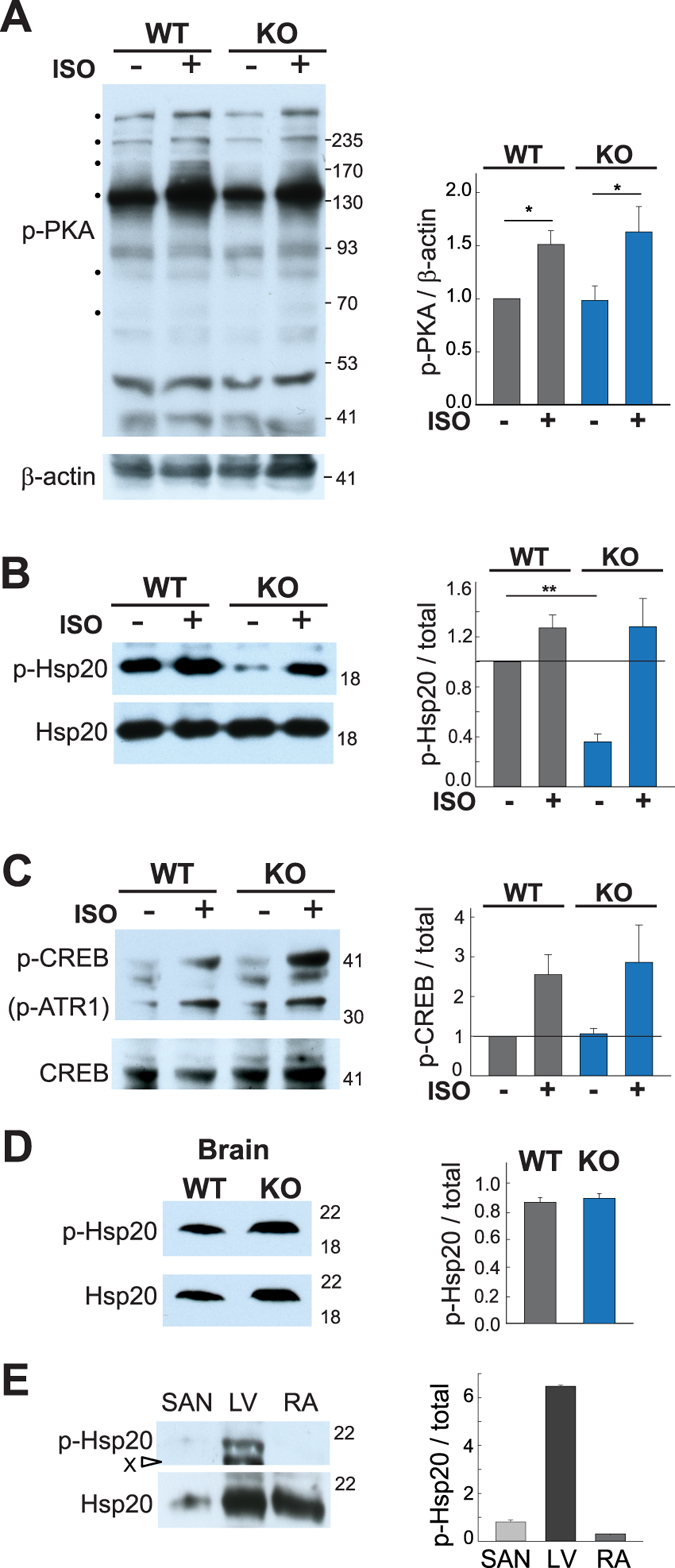
Figure 3.

Decreased PKA phosphorylation of Hsp20 in AC9−/−. WT and AC9−/− mice were injected with saline or isoproterenol (2 µg/g body weight, IP). Animals were sacrificed 4 min later and heart tissue was harvested. Cardiac extracts were prepared in the presence of phosphatase inhibitors. Equal protein supernatants were subjected to WB analysis with (A) anti-p-PKA substrate, (B) anti-p-Hsp20, and C) anti-p-CREB. Quantitation of phospho-PKA was normalized to beta-actin levels (A) while the corresponding total protein was quantitated by WB (n = 5–7) and the ratio of phosphoprotein to total was quantitated for p-Hsp20 (B) and p-CREB (C). (D,E) WB and quantitation of the ratio of phosphorylated to total Hsp20 in D) brain from WT and AC9−/− mice (n = 3) and (E) sinoatrial node, left ventricle, and right atrium (n = 3). Graphs for quantitation of the ratio of phosphorylated to non-phosphorylated protein are shown to the right for each panel. **P < 0.01 t-test on raw intensity values. Full-length WBs are presented in Supplementary Fig. S6.
