Figure 2.

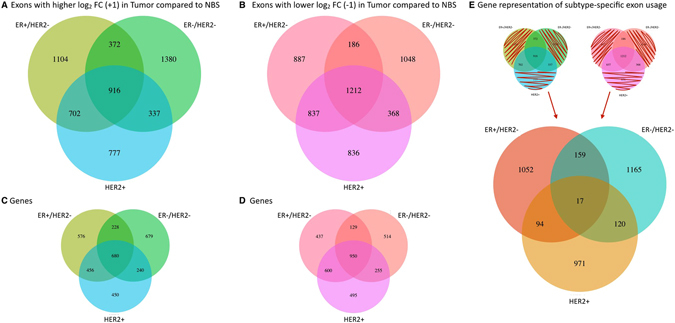
Alternative exon usage in tumor subtypes compared to NBS. The number of exons identified as differentially spliced or transcribed in each tumor class compared to NBS with (A) higher FC, and (B) lower FC. The number of genes represented by the called exons is shown for each tumor subtype in (C and D). Many genes include both higher and lower FC exons. The number of genes representing the exons that are unique to subtype include both genes with differential usage of unique exons in one subtype only, as well as exons with different usage in two subtypes (+1 in one subtype, −1 in another) (E). The overlapping genes undergo distinct transcriptional and/or post-transcriptional events of specific exons in a subtype specific manner.
