
Figure 4.
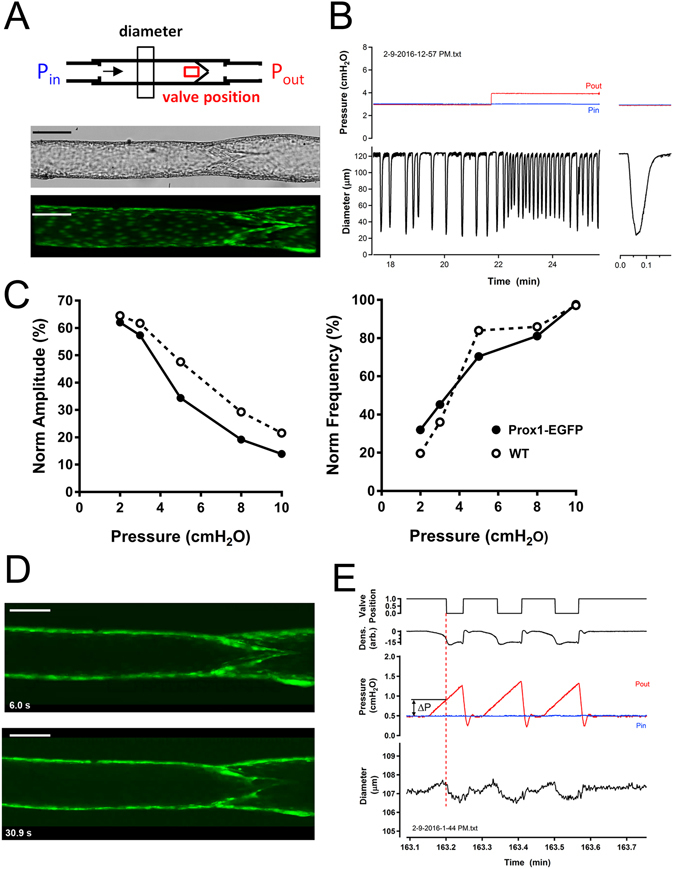
Functional analyses of the mesenteric lymphatics in Prox1-EGFP rat. (A) Diagram of an ex vivo study system of Prox1-EGFP lymphatic vessels. Pin and Pout refer to the input and output pressures, respectively, of the two cannulating pipettes. Arrow indicates the normal direction of flow. Windows for diameter tracking (by edge detection) and valve position (by densitometry) are shown by black and red boxes, respectively. Top image is a bright field image of an ex vivo vessel; bottom image is a confocal image (maximum intensity projection) of the same vessel. (B) Example trace showing spontaneous contractions of a lymphatic vessel when Pin and Pout were equal and after Pout was slightly elevated. Traces were recorded under fluorescence illumination by edge detection of the outer edge of the LEC layer. The response to Pout elevation is typical of wild-type vessels (see text). (C) Plots of changes in amplitude and frequency as functions of pressure, with both variables averaged over multiple contraction cycles. The raw amplitude and frequency data were normalized to their respective values at 10 cmH2O and plotted as a function of pressure. For comparison, representative data from a WT Sprague-Dawley rat mesenteric lymphatic vessel are shown as previously38. (D) Confocal images of a passive lymphatic valve in open (top) and closed (bottom) states, as determined by the trans-valve pressure gradient. (E) Valve closure test conducted under fluorescence illumination with valve position determined by videodensitometry. With Pin and Pout equal, the valve is open; ramp-wise Pout elevation with Pin held constant, induces valve closure when the adverse pressure gradient exceeds 0.4 cmH2O. Scale bars: 100 µm.