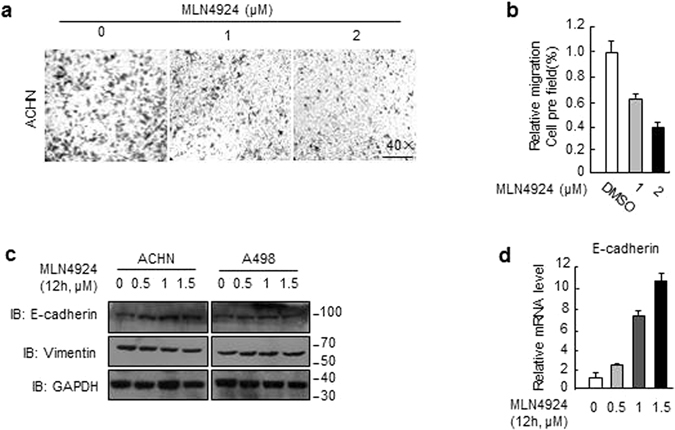
Figure 5.

MLN4924 suppressed migration by up-regulating E-cadherin and down-regulating Vimentin. (a) Cells were treated with indicated concentrations of MLN4924 for 12 hrs before being subjected to Transwell migration analysis. Shown are representative images (b) or mean ± SD from 200 cells per well in triplicates. Similar results were obtained in three independent experiments. (c) Cells were treated with MLN4924 at indicated concentrations and subjected to Western blot analysis. (d) Cells were treated with MLN4924 at indicated concentrations, followed by total RNA isolation and qRT-PCR analysis for E-cadherin. Shown is mean ± SD. Similar results were obtained in three independent experiments.
