
Figure 5.
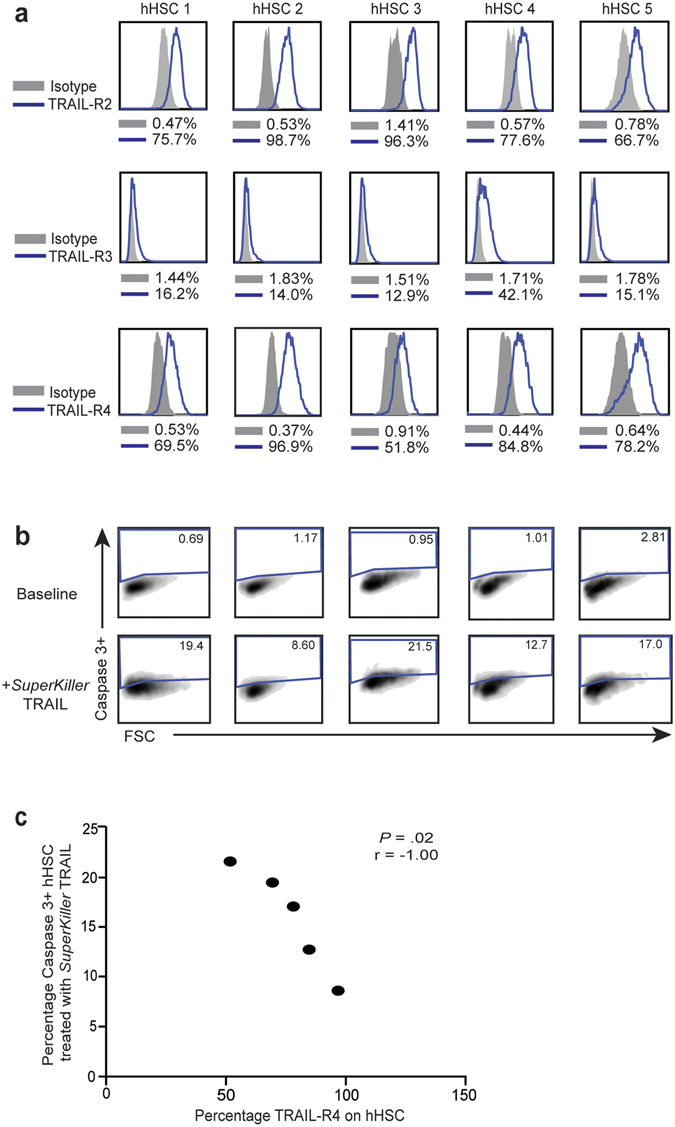
Relationship between expression levels of TRAIL-receptors and resistance to TRAIL-mediated apoptosis. (a) Expression levels of TRAIL-R2 (top panel), TRAIL-R3 (middle panel) and TRAIL-R4 (bottom panel) in blue against matched isotype (grey) on in vitro culture-activated hHSC from five different donors (hHSC1–5). (b) Levels of induction of caspase-3 in hHSC at baseline and on in vitro treatment with SuperKiller TRAIL. (c) Correlation of expression levels TRAIL-R4 on hHSC against their capacity to undergo TRAIL-mediated apoptosis.