
Figure 9.
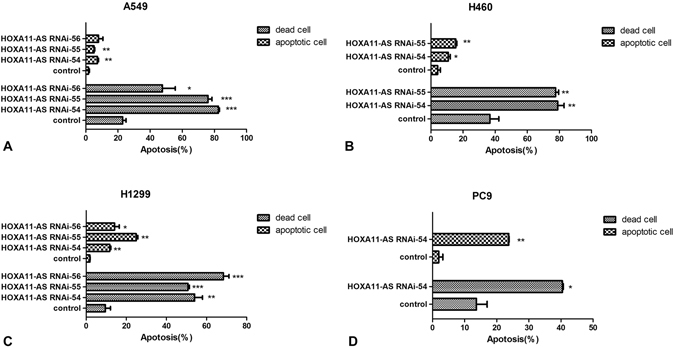
HOXA11-AS RNAi promoted apoptosis in A549, H1299, H460 and PC9 cell lines based on a flow cytometry assay. (Note: control, lenti-control virus). (A) Comparison of the apoptosis rate and mortality rate of A549 cells after silencing HOXA11-AS expression (*P < 0.05, **P < 0.01, ***P < 0.001). (B) Comparison of the apoptosis rate and mortality rate of H460 cells after silencing HOXA11-AS expression (*P < 0.05, **P < 0.01, ***P < 0.001). (C) Comparison of the apoptosis rate and mortality rate of H1299 cells after silencing HOXA11-AS expression (*P < 0.05, **P < 0.01, ***P < 0.001). (D) Comparison of the apoptosis rate and mortality rate of PC9 cells after silencing HOXA11-AS expression (*P < 0.05, **P < 0.01, ***P < 0.001).