
Figure 1.
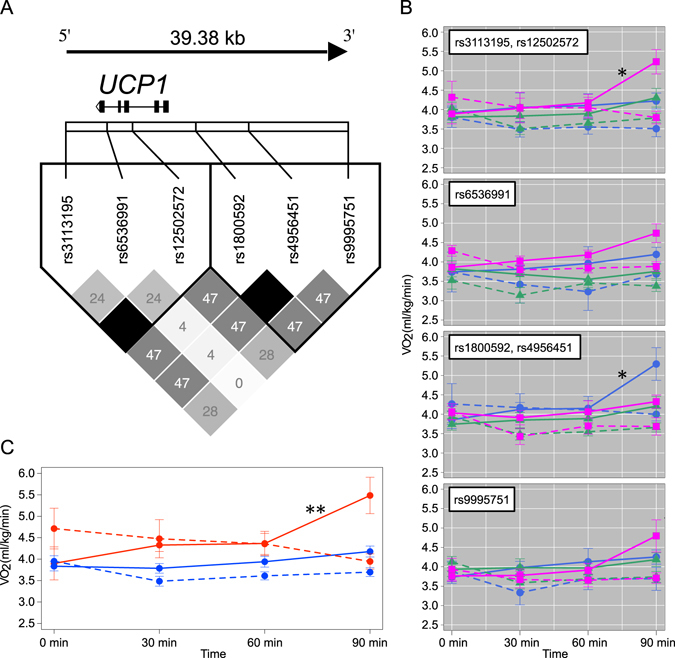
Physiological differences among UCP1 genotypes. (a) The physical positions and LD structure of UCP1 SNPs genotyped in this study. A pairwise r 2 value is shown in each square. Darker gradient color indicates higher r 2 values, and black indicates an r 2 of 1. The haplotype block defined by the Gabriel et al. method31 is represented by the enclosure of the black line. (b) Time series variations of VO2 (+/− s.e.m.) in each SNP and that genotype. The solid and dashed lines show the changes under 16 and 28 degrees Celsius, respectively. The colors of the lines represent each genotype (blue: a homozygote of an ancestral allele; magenta: a homozygote of a derived allele; green: heterozygote of ancestral/derived alleles). (c) Time series variations of VO2 (+/− s.e.m.) between haplotypes. The solid and dashed lines show the changes under 16 and 28 degrees Celsius, respectively. The colors of the lines represent each genotype (red: a homozygote of GnGTAn haplotype; blue: a homozygote and heterozygote of other haplotypes). The asterisks indicate a significant increase compared with other genotypes (*P < 0.05; **P < 0.01).