
Figure 2.
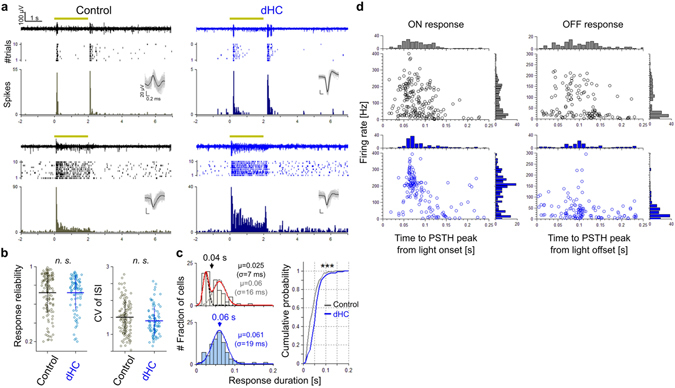
Changes in firing properties of RGCs by the depletion of horizontal cells. (a) Light-evoked responses recorded from control and dHC retinas. Examples of transient (upper) and sustained (lower) responses evoked by light stimulation (1,600 × 1,600 μm square, 2 s, yellow). Raw data for one trial (top), spike raster plots (middle), and the PSTH (30 ms bin, 10 trials, bottom). Inset, sorted spikes. (b) Left, Pearson’s r between trials. Right, CV of inter-spike interval. These measures were calculated from light onset (0 s) to 4 s. Gray, 186 RGCs in 6 control retinas; cyan, 136 RGCs in 4 dHC retinas. Bars, mean ± SD; n.s., not significant. (c) Left, histograms of response duration (upper, control; lower, dHC). Duration is defined as a half width at half maximum of PSTH. Histograms are fitted by Gaussian functions (control, red line, sum of two Gaussians, each of which correspond to transient [dotted black] and sustained [dotted gray]; dHC, blue line, single Gaussian). Right, cumulative probability of the histograms. gray, control. blue, dHC. p = 5.05 × 10⁻⁴. (d) Population analysis of light-evoked responses. Abscissa, time to the PSTH peak from the light onset or from the light offset. Ordinate, median firing rate for each RGC. Distribution of light-evoked RGC response property in the dHC retinas was different from that in control retinas (114 ON response and 108 OFF response in control retinas, 78 ON response and 79 OFF response in dHC retinas; ON latency, Kolmogorov-Smirnov test, p = 0.0044, OFF latency, Kolmogorov-Smirnov test, p = 6.59 × 10⁻⁶; ON firing rate, Kolmogorov-Smirnov test, p = 6.58 × 10⁻⁶, OFF firing rate, Kolmogorov-Smirnov test, p = 7.77 × 10⁻¹¹).