
Figure 5.
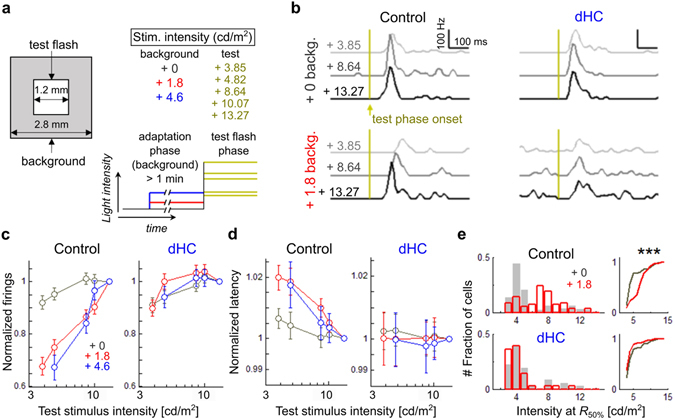
Global light adaptation mediated by horizontal cells. (a) Stimulus schema. Intensity of the test flash (1,200 × 1,200 μm square, 2 s) was changed (3.85, 4.82, 8.64, 10.07, 13.27 cd/m2) on various background intensities (2,800 × 2,800 μm square, 0, 1.8, 4.6 cd/m2). (b) Responses to the test flash (3.85, 8.64, 13.27 cd/m2, PSTH of 0.01 s-bin) on the background with low (black; 0 cd/m2) or medium intensity (red; 1.8 cd/m2). yellow, test flash onset. Left, control. Right, dHC. (c) Spike number for 0.4 s from the test flash onset on various background intensities. Values were normalized to the spike number during the maximum test flash. Bars, mean ± SD. (d) Time-to-peak latency of the PSTH (denoted in c) among various background intensities. Values were normalized to the latency during the maximum test flash. Bars, mean ± SD. (e) Left, histograms of the intensity causing 50% of the max spike numbers (R 50%) with the low (gray, +0) or medium (red, +1.8) background intensity. Upper, control; lower, dHC. Right, cumulative distribution of R 50%. 156 RGCs in 4 control retinas. 148 RGCs in 4 dHC retinas. Kolmorov-Smirnov test, p = 7.79 × 10⁻¹⁰ in control retina, p = 0.75 in dHC.