
Figure 1.
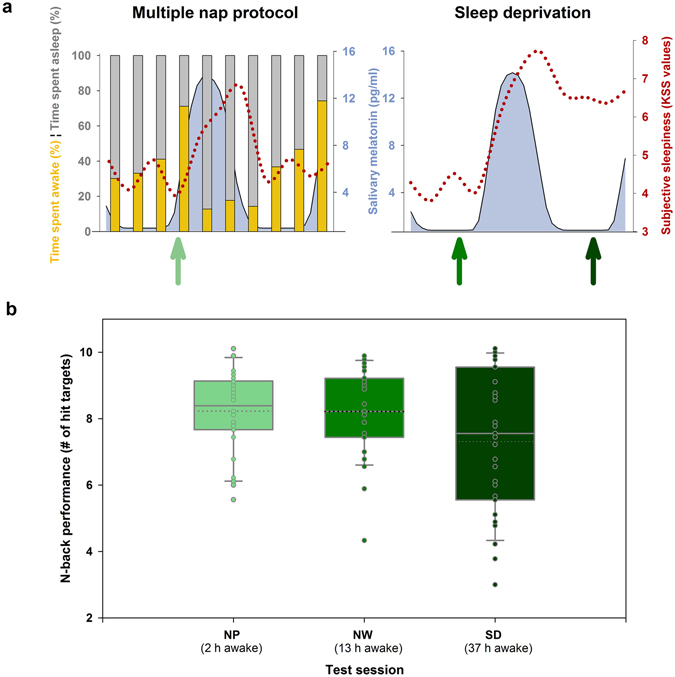
Effects of multiple napping and sleep deprivation. (a) In the 40-hour multiple nap protocol (NP), sleep efficiency was assessed over the 24-hour cycle. The ability to initiate and maintain sleep (nap sleep efficiency, grey bars, depicted as the percentage of sleep duration [all sleep stages combined] per total nap time) continuously decreased across daytime with lowest values (29%) in the late evening, while highest nap sleep efficiency (82–87%) was attained during the biological night (the latter indicated by melatonin secretion). In NP, subjective sleepiness (red dotted line) was low during daytime and high during night-time and early morning hours. A similar time course was observed during the 40-hour total sleep deprivation (SD). However, as sleep pressure levels accumulated in SD, an increase in sleepiness particularly after 24 hours of time into the protocol was observed when compared to NP. fMRI scanning sessions were scheduled in the late evening (green arrows), when wakefulness was strongly promoted by the circadian system. Participants were scanned once in the NP and two times in the sleep deprivation protocol (after 13 hours of wakefulness [i.e., under normal sleep pressure, referred to as normal waking (NW)] and 37 hours of wakefulness [i.e., under high sleep pressure, referred to as SD]). (b) Box plots illustrate median (solid line) and mean (dotted line) performance in the n-back across the scanning sessions, i.e., after different times awake before data acquisition. Mean performance was particularly impaired after 37 hours of continuous wakefulness (SD), mirroring the negative impact of high sleep pressure on working memory performance. Individual data are shown as dots.