
Fig. 11.
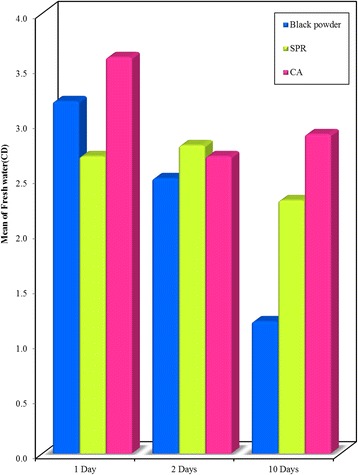
Bar graph - Comparison between the Black powder, SPR and CA development techniques at different time intervals on plastic surface recovered from freshwater. It shows that highest mean visibility score of prints developed using CA
Official websites use .gov
A
.gov website belongs to an official
government organization in the United States.
Secure .gov websites use HTTPS
A lock (
) or https:// means you've safely
connected to the .gov website. Share sensitive
information only on official, secure websites.
Bar graph - Comparison between the Black powder, SPR and CA development techniques at different time intervals on plastic surface recovered from freshwater. It shows that highest mean visibility score of prints developed using CA