
Figure 3.
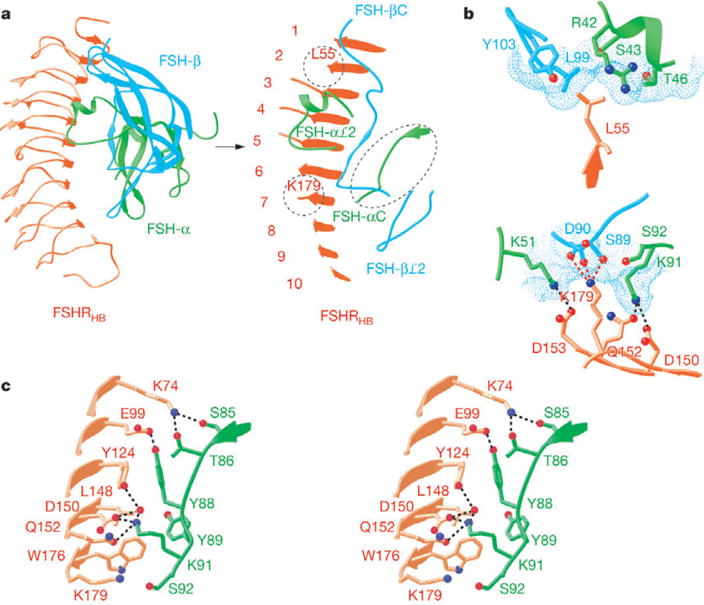
Interactions at the receptor—ligand interface. a, Ribbon diagram showing the top view of the FSH—FSHRHB complex. The view in the right panel is tilted to highlight the regions of FSHRHB (red), and FSH-α (green) and FSH-β (cyan) chains that are involved in direct contacts at the receptor—ligand interface. Dashed circles mark the locations of L55 and K179 in the FSHRHB structure. b, Detailed views of the interactions at the specificity pockets for L55 and K179 of FSHRHB. The dotted molecular surface of FSH is shown in cyan in each panel. c, Close-up stereo view of the interactions between the C-terminal region of FSH-α and FSHRHB.