
Figure 5.
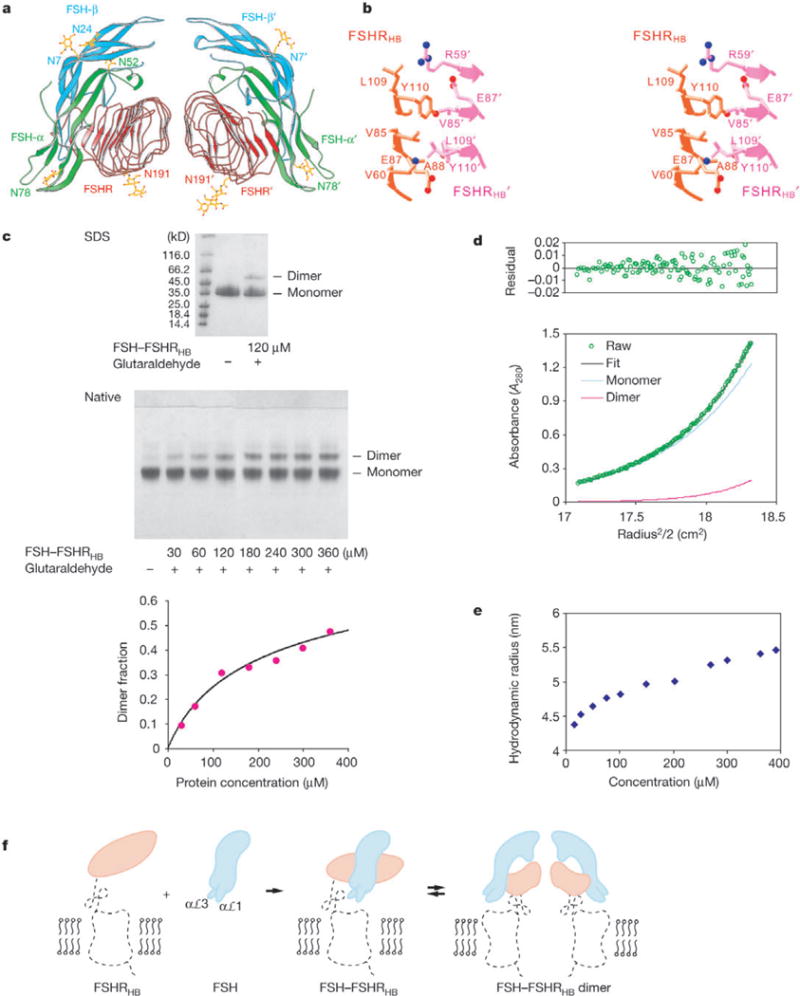
Dimer of the FSH—FSHRHB complex. a, Ribbon diagram of a non-crystallographic dimer of the FSH—FSHRHB complex (FSH—FSHRHB and FSH’—FSHRHB’). The receptor is in red, and the α- and β-chains of the hormone are in green and cyan, respectively. b, Stereo view of the direct contacts (distances <4Å) observed at the dimer interface. c, Crosslinking of the FSH—FSHRHB complex by glutaraldehyde. The SDS gel contains the FSH—FSHRHB control (lane 2) and 120 μM FSH—FSHRHB complex reacted with 120 μM glutaraldehyde (lane 3). The native gel contains the FSH—FSHRHB control (lane 1), and FSH—FSHRHB complex reacted with glutaraldehyde at a 1:1 molar ratio and at concentrations of 30, 60,120,180, 240, 300 and 360 μM (lanes 2–8, respectively). Densities from the dimer bands on native gels as a function of protein concentration were fitted to the dimerization equation with a single Kd (453 ± 140 μM) for six experiments, with two repeated trials for each molar ratio of FSH—FSHRHB to glutaraldehyde (3:1, 3:2, 1:1). The average dimer fraction at each protein concentration is plotted together with the fitted curve. d, Analytical ultracentrifugation analysis of dimer formation by the FSH— FSHRHB complex. Shown are equilibrium sedimentation data (green open circle) taken at 12,000 r.p.m. with a loading concentration of 1.05 mg ml−1, and the best-fit curve (black solid line through the data) for a monomer—dimer reversible equilibrium model. Under the fit, the theoretical sum is deconvoluted into contributions from the monomer (blue line) and dimer (red line) species, respectively. Residuals in absorbance units at 280 nm are shown at the top of the plot. e, Apparent hydrodynamic radii of FSH—FSHRHB measured by dynamic light scattering at concentrations of 15, 27, 50, 75, 100, 150, 200, 270, 300, 360 and 390 μM. f, Model for FSHR activation by FSH. Projections of the FSH—FSHRHB complex and bovine rhodopsin structures are used to represent the hormone (cyan), the hormone-binding domain (orange) and the linker and transmembrane domain (black dotted trace) of the receptor. The αℒ1 and aL3 loops of FSH are proposed to contact the transmembrane domain directly.