
Figure 5. A Comparison of Mononuclear Cell Subsets and NK Cell Subsets From the Circulating Mononuclear, the MH-Mononuclear, and the Entire Liver Mononuclear Cells.
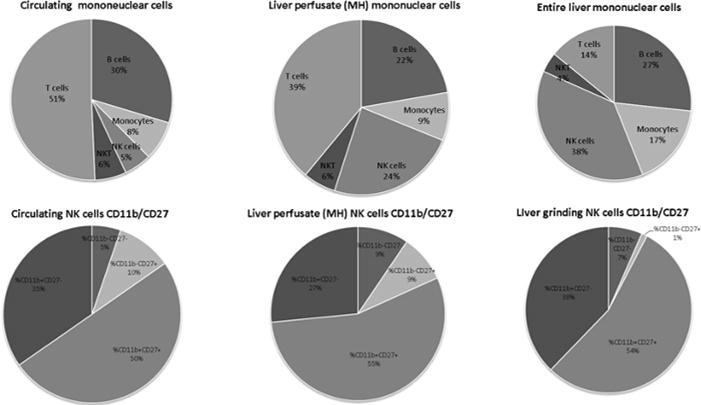
FACS analysis shows clear differences in the composition of following cell subpopulations: monocytes (CD161dim), NK cells (CD161 bright), T cells (CD3), B cells (CD45), and NKT (CD161 and CD3) cells as well as differences in the maturation profile (CD11b/CD27) between different compartments.