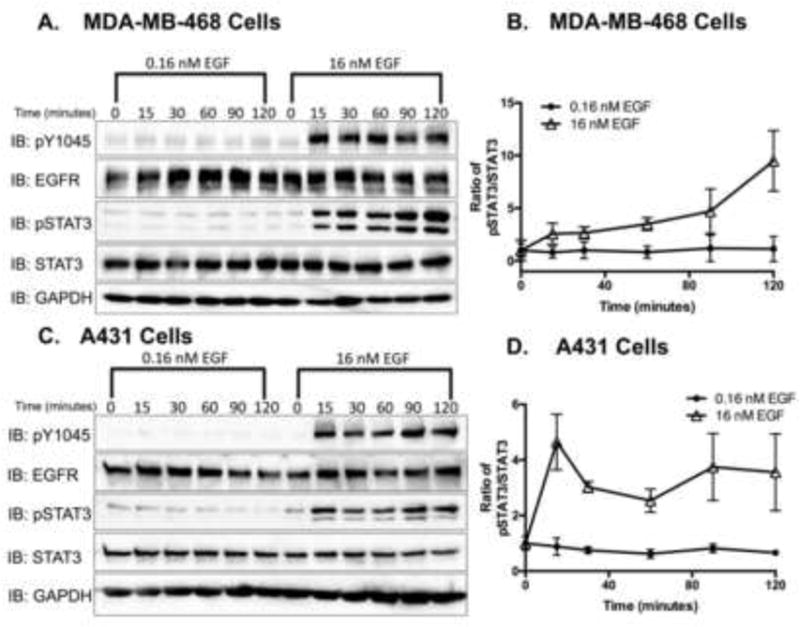
Figure 2. STAT3 is tyrosine phosphorylated in response to high, but not low, EGF concentrations.

Serum-starved A. MDA-MB-468 and B. A431 cells were stimulated with 0.16 nM and 16 nM EGF ligand for 0–120 minutes. Cell lysates (20 μg and 15 μg, respectively) were resolved by 12% SDS-PAGE and were assessed for phospho-EGFR (pY0145), EGFR, pSTAT3 (Tyr705), STAT3 and GAPDH, via immunoblot analysis. C. MDA-MB-468 and D. A431 immunoblot data were quantified, and pSTAT3 was normalized to total STAT3. Data are expressed as the average ± SEM (n=3) relative to untreated samples.
