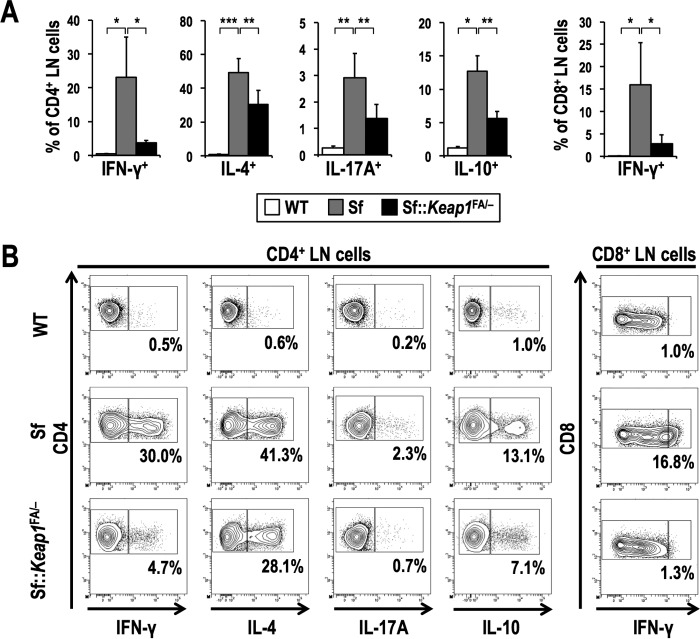
FIG 5.
Systemic NRF2 activation inhibits cytokine production of T cells in Sf mice. (A) Frequencies of effector T cell subsets in the LNs of WT (for IL-10+ cells, n = 4; for others, n = 7), Sf (for IL-10+ cells, n = 3; for others, n = 6), and Sf::Keap1F/− (for IL-10+ cells, n = 4; for others, n = 8) mice. Percentages of the IFN-γ+, IL-4+, IL-17A+, and IL-10+ fractions of CD4 single-positive cells and the percentage of the IFN-γ+ fraction of CD8 single-positive cells are shown. The values represent the means and SD. (B) Representative contour plot data for the IFN-γ+, IL-4+, IL-17A+, and IL-10+ fractions of CD4 single-positive LN cells and the IFN-γ+ fraction of CD8 single-positive LN cells, with the percentages of cytokine-positive fractions shown. *, P < 0.05; **, P < 0.005; ***, P < 0.0005.

