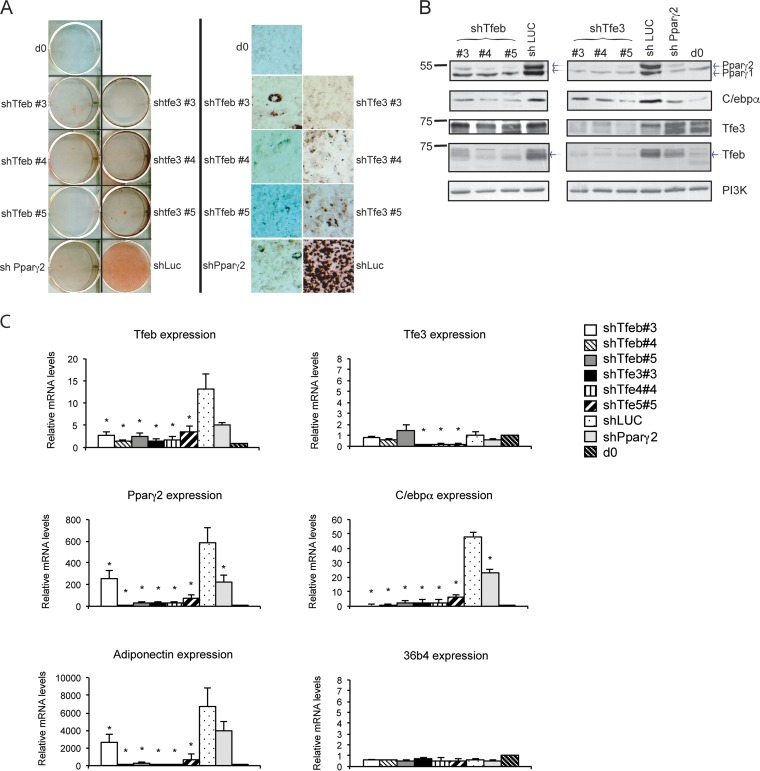
FIG 4.
Knocking down either Tfe3 or Tfeb impairs adipocyte differentiation. (A) (Left) Scanned cell culture dishes showing Oil Red O staining (day 7) of 3T3-L1 cells treated with shRNAs. Mock cells are cells from day 0 (d0); positive-control cells have shRNA targeted to luciferase (shLuciferase) and knocked down to Tfeb (shTfeb#3, shTfeb#4, and shTfeb#5) or knocked down to Tfe3 (shTfeb3#3, shTfeb3#4, and shTfeb3#5). (Right) Microscopy images of the Oil Red O staining (day 7) of 3T3-L1 cells shown on the left (magnification, ×248). (B) Western blot analysis of transcriptional regulators after knocking down either Tfeb or Tfe3. 3T3-L1 cells were stably transduced with the respective shRNAs shown in panel A, and after reaching confluence, cells were exposed to the differentiation cocktail. At day 7, protein extracts were obtained and analysis of transcription factors was carried out. Controls are mock cells at day 0, shPparγ2, and shLuciferase. (C) Gene expression analysis of transcriptional regulators after knocking down either Tfeb or Tfe3. 3T3-L1 cells were stably transduced with the respective shRNAs, and after reaching confluence, cells were exposed to the differentiation cocktail. At day 7, total RNA was harvested and reverse transcribed, and gene expression was analyzed by real-time RT-PCR. Data were normalized to 18S and are means ± SD, relative to day 0 (n = 3). *, P < 0.05 (Student's t test [two tailed]).

