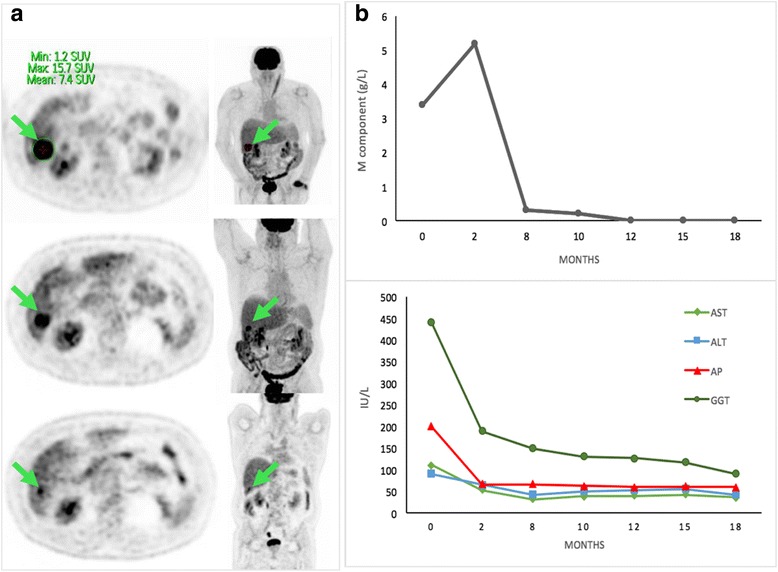
Fig. 2.

18Fluorodeoxyglucose positron emission tomography-computed tomography images and biologic graphics prior to and following therapy. a Images showing axial and coronal 18fluorodeoxyglucose positron emission tomography-computed tomography of the lesion in segment VI before radiosurgery, at month 12 with a 50% decrease and at month 18 with a 75% decrease. The arrow indicates the plasmacytoma lesion in both planes. All images show a partial remission of the metabolic activity of the nodule after Cyberknife® therapy compared to month 0. b The figures show reduced IgG M component with a maximum of 5.2 g of IgG/L and standardization from month 12 with normal immunofixation. The graphic below shows the concentration of liver enzymes, alkaline phosphatase, and gamma-glutamyltransferase. ALT alanine aminotransferase, AP alkaline phosphatase, AST aspartate aminotransferase, GGT gamma-glutamyltransferase, SUV standardized uptake value
