
Fig. 2.
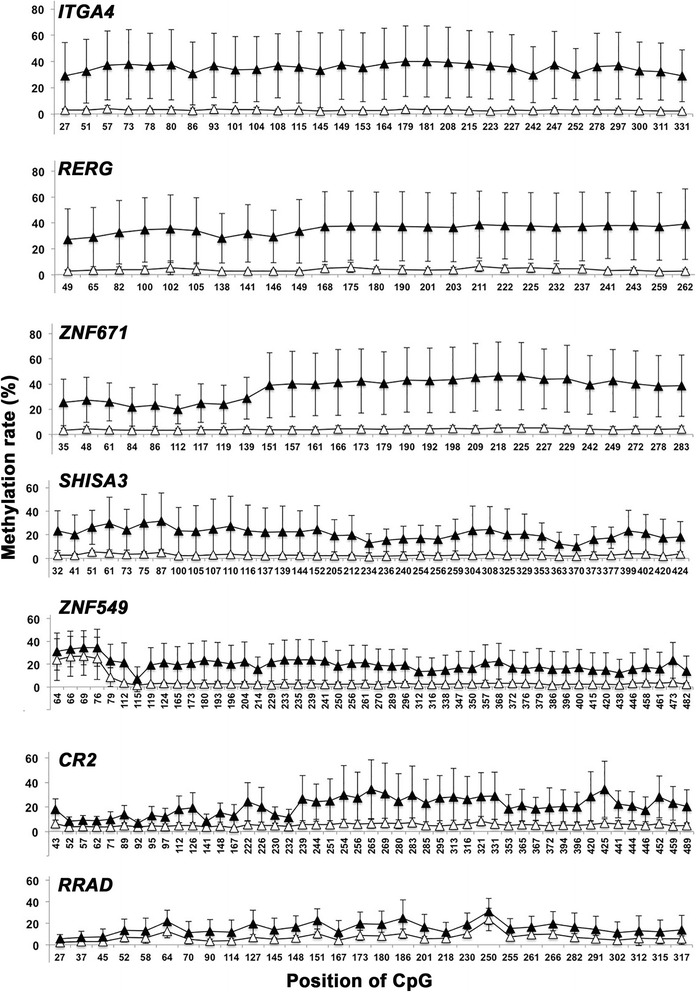
CpG methylation rates in NPC and NNE tissues. Graphs show mean and SD (%) in every CpG from NPC (n = 9, closed triangles) and NNE (n = 9, open triangles)
Official websites use .gov
A
.gov website belongs to an official
government organization in the United States.
Secure .gov websites use HTTPS
A lock (
) or https:// means you've safely
connected to the .gov website. Share sensitive
information only on official, secure websites.
CpG methylation rates in NPC and NNE tissues. Graphs show mean and SD (%) in every CpG from NPC (n = 9, closed triangles) and NNE (n = 9, open triangles)