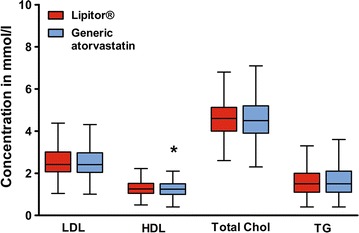
Fig. 2.

Box- and whisker plot of mean blood concentrations of LDL-cholesterol (LDL), HDL-cholesterol (HDL), total cholesterol (total chol) and triglycerides (TG) with boxes indicating the upper and lower quartiles. Tukey method was used to plot whiskers. Outliers are not shown in the diagram. Asterisk represents a statistically significant difference in HDL-cholesterol levels before and after the transition (p < 0.05; Wilcoxon signed-rank test)
