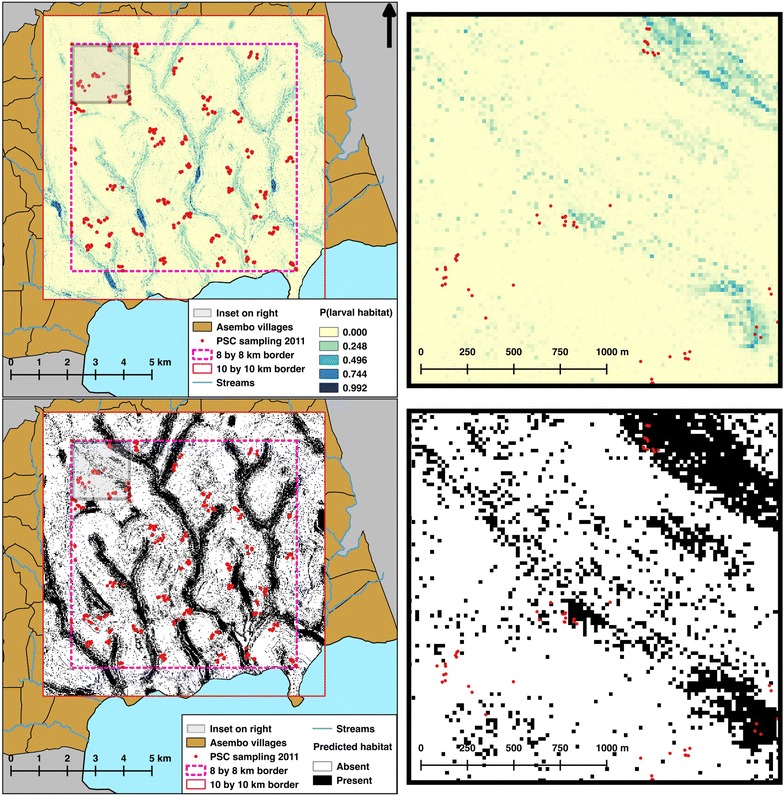
Fig. 2.

Predictive model of Anopheles larval habitat presence. The top two panels show the output of the predictive model as the probability (P) of a larval habitat being present in each 20 by 20 m pixel. The bottom two panels show the probabilities converted to either “present” (i.e. at least one larval habitat is expected to be present in the 20 by 20 m pixel) or “absent”, using a threshold of P = 0.020. Maps on the right show close-up views of the maps on the left
