Fig. 3.

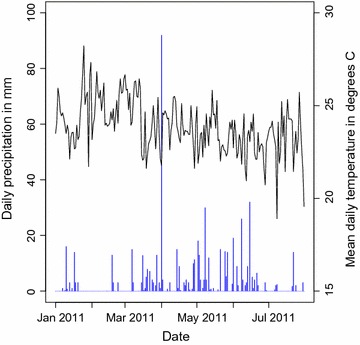
Weather data prior to and during study. The daily total precipitation (blue bars) and daily mean temperature (black line) from 1 January to 31 July 2011 at the Kisumu Airport weather station

Weather data prior to and during study. The daily total precipitation (blue bars) and daily mean temperature (black line) from 1 January to 31 July 2011 at the Kisumu Airport weather station