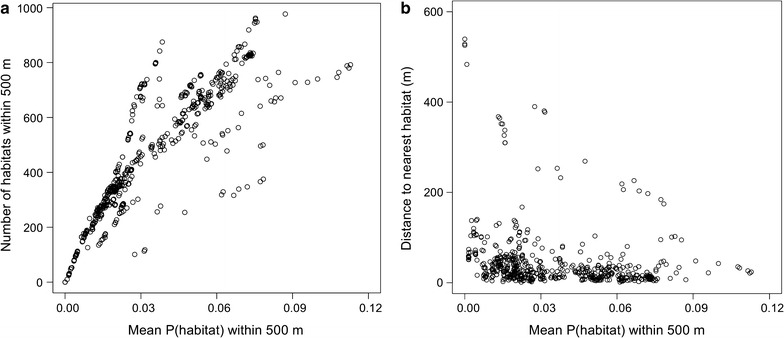
Fig. 5.

Scatterplots comparing two different larval habitat indices (a number of habitats within 500 m; b distance to nearest habitat in metres) with the mean probability of a habitat within 500 m. Each dot represents one of the 525 houses sampled in this study. P (habitat), probability of a larval habitat
