
Fig. 4.
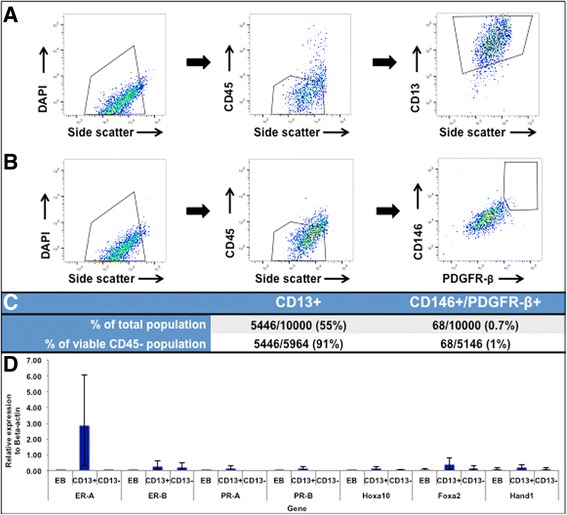
FACS sorting of CD13+ and CD146+/PDGFR-β + cells from mouse EBs. Total EB cells gated as DAPI+/CD45−/CD13+ (a) and DAPI+/CD45−/CD146+/PDGFR-β + (b) are shown. Graph legends indicate percent of parent population. c shows the proportion of CD13+ and CD146+/PDGFR-β + cells isolated from both the total cell population and viable CD45- population in EB medium by flow cytometry. Quantitative RT-PCR revealed significantly up-regulated expression of Hoxa10, Foxa2, ER-A, PR-A and PR-B, in a CD13+ (stromal) subpopulation (d). The x-axis represents the gene and the y-axis represents the relative fold change to the Beta-actin gene control. Standard deviations of means are shown with brackets