
Fig. 5.
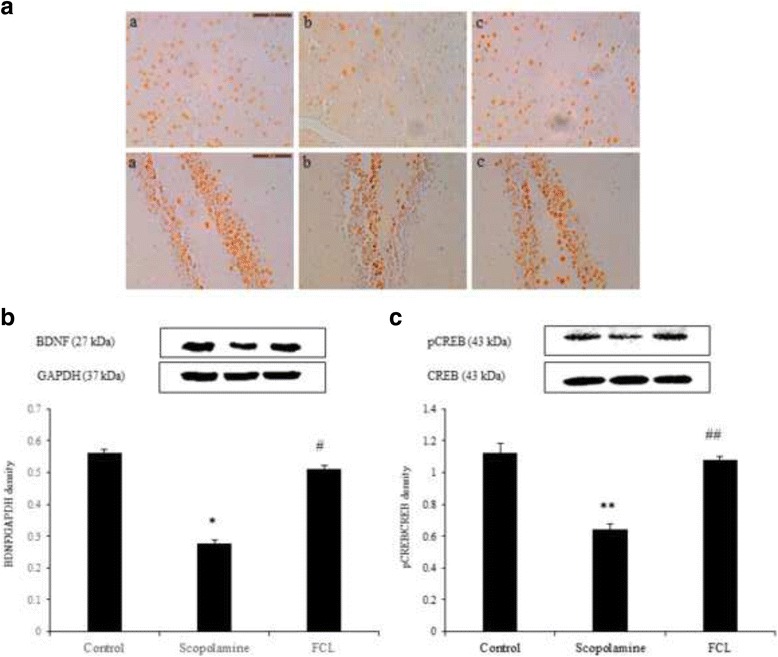
Effects of FCL on pCREB and BDNF in cortex and hippocampus of scopolamine-induced memory deficit. Photomicrographs (a) showing the pCREB immunoreactivity in sections of cortex and the dentate gyrus region of hippocampus. Original magnification was 40× (a-c). Scale bar = 50 μm. The expression levels were measured by Western blot analysis (b, c). The relative expression levels of BDNF (27 kDa) and pCREB (43 kDa) were determined by densitometry and normalized by internal controls, GAPDH (37 kDa) and CREB (43 kDa). Data represent means ± SEM (n = 3). * P < 0.05, ** P < 0.01 as compared with the control group, # P < 0.05, ## P < 0.01 as compared with the scopolamine group