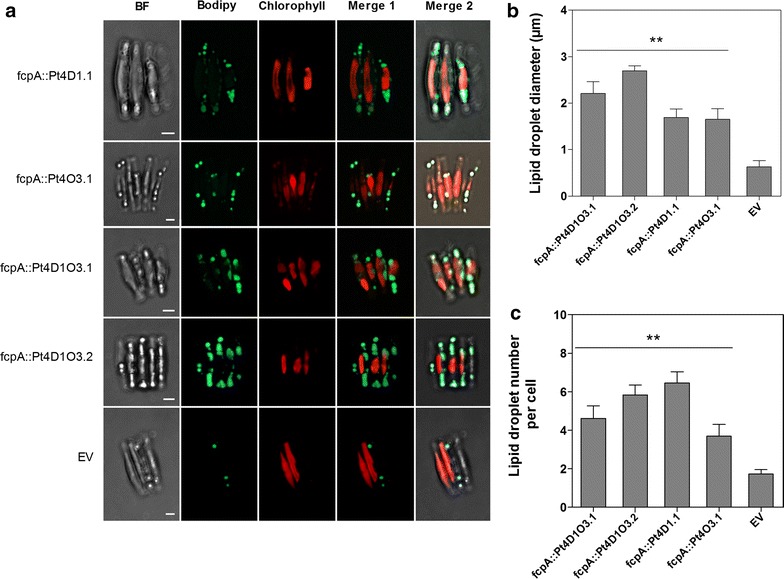
Fig. 4.

Assessing the effect of expressing AtOLEO3 in Pt4 on LD number and diameter. The LD analysis was done for the single gene expressing lines, Pt4D1.1 and line Pt4O3.1 as well as for the double gene co-expressing lines Pt4D1O3.1 and Pt4D1O3.2; the EV line was used as a control (a). These were analyzed after BODIPY 493/504 staining of cells at day 14 in the growth phase. Images are composites of BF, BODIPY 493/504 fluorescence (green), chlorophyll autofluorescence (red) and merged images. Scale bar 5 µm. The mean values on the bar graphs represent LD diameter (b) and number (c). The mean values are a representative of three technical replicates and the error bars were calculated from the standard deviation. p values were calculated from the student’s t test, where (double asterisk) means p ≤ 0.01. BF bright field, EV empty vector, LD lipid droplet. Raw data for LD diameter and number per cell can be obtained from Additional file 14
