
Fig. 6.
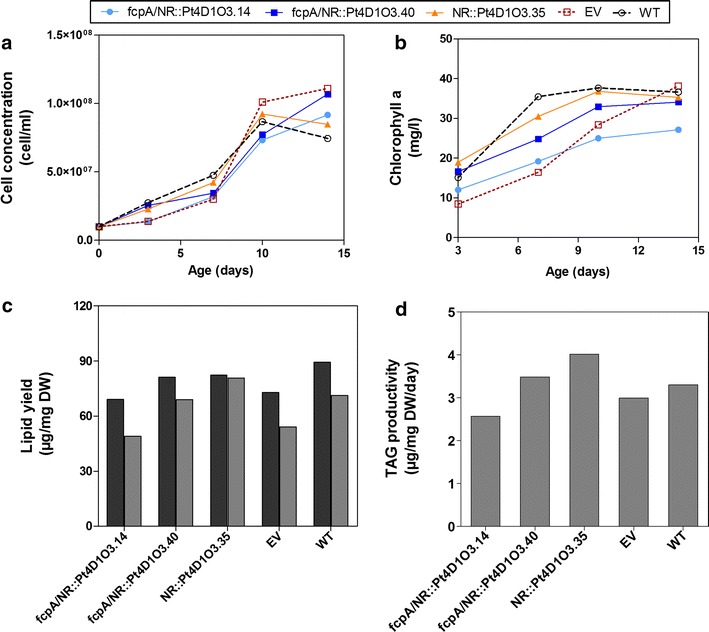
The impact of the NR promoter on growth and lipid yield in lines co-expressing ScDGA1 and AtOLEO3. Growth profiles are based on cell concentration (a) and chlorophyll a content (b). Maximum lipid yields (c) were obtained from day 17, a time point where the highest TAG yields were accumulated and TAG productivities (d) were calculated from maximum TAG yields. The bar graphs represent mean values of two independent studies, where in each study there were two biological replicates. EV empty vector, NR nitrate reductase, TAG triacylglycerol, WT wild type. Raw data for growth profiles, lipid yields, and TAG productivities can be obtained from Additional file 14