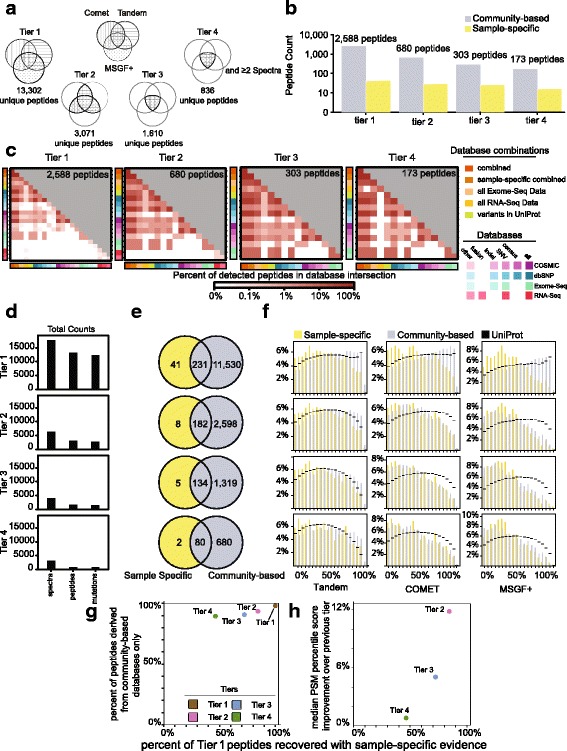
Fig. 2.

Detection of variant proteins within the nine deep proteomes. a Numbers of unique variant peptides identified in tiers 1–4 using MS data from the nine deep proteomes. b Unique variant peptides identified within the prostate cancer cell-line PC3 across tiers 1–4 (log10 scale). c Heatmaps depicting the percent contribution of each database towards the total number of peptides identified for that tier in PC3. The number of peptides overlapping each database pair is provided as well. Color scale is in log10. d Total number of spectra, peptides, and unique mutations identified by tier. e Summary of peptides identified within the nine deep proteomes within sample-specific databases or within community-based databases (tiers 1–4). f Percentile score distribution summary by algorithm and tier. X-axis ranges from high scoring peptides (0’th percentile) to lower scoring peptides (100’th percentile). A similar figure using original e-value scores is depicted in Additional file 1: Figure S6. The distribution of peptide scores from a search against a standard UniProt database is shown in black. g Increasing the stringency of identifying a peptide influences the percentage of peptides present in community-based databases between tiers 1 and 2 more than moving to subsequent tiers. h When compared, tier 2 peptides tend to be higher ranked by 12% than tier 1 peptides; this improvement in peptide rank drops off quickly from tier 2 to tier 3 (4%) and tier 3 to tier 4 (1%)
