Fig. 2.

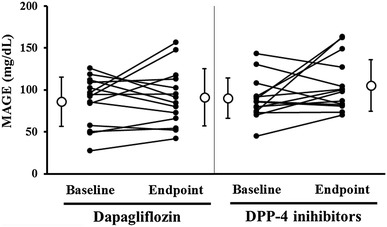
Comparison of individual changes in MAGE for each drug between the study baseline and endpoint. White circles and lines are mean and SD, respectively

Comparison of individual changes in MAGE for each drug between the study baseline and endpoint. White circles and lines are mean and SD, respectively