Fig. 2.

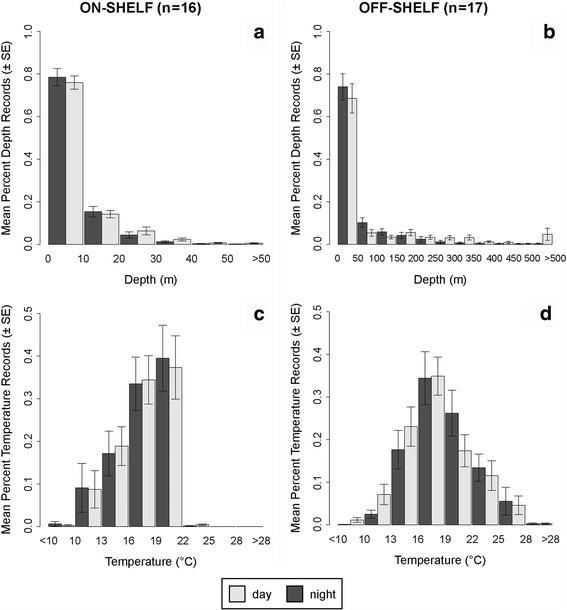
Percent time at depth (a–b) and temperature (c–d) on (left) and off (right) the continental shelf (marked by 200 m bathymetry contour) and separated by day and night

Percent time at depth (a–b) and temperature (c–d) on (left) and off (right) the continental shelf (marked by 200 m bathymetry contour) and separated by day and night