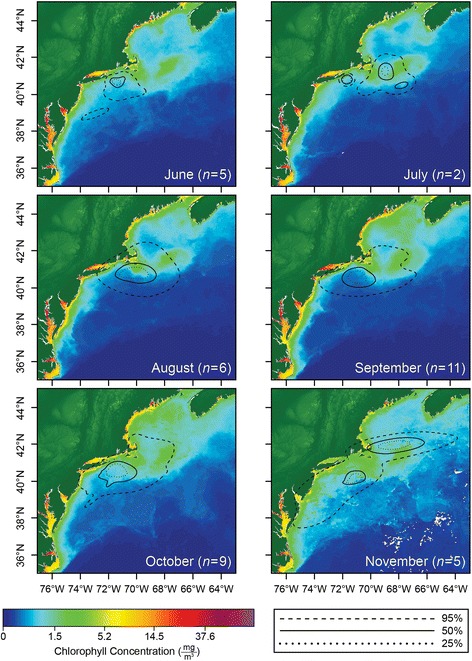
Fig. 3.

On-shelf utilization distribution contours representing the high density regions, derived from daily estimated locations, and considering only locations from the on-shelf habitat (marked by the 200 m bathymetry contour). Each month including blue shark shelf residency is displayed and overlaid on chlorophyll a concentration, indicative of primary productivity
