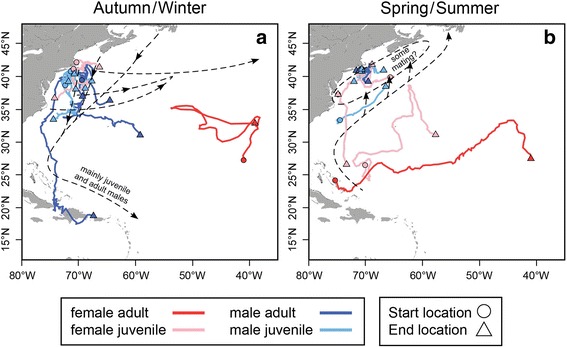
Fig. 7.

All horizontal movement tracks (n = 18) represented by solid colored line indicating demographic group and separated by season (a–b). Start and end locations represent the first and last locations within the corresponding season, respectively, for each individual. Existing/previously published/accepted western Atlantic blue shark migration model, previously inferred from mark-recapture data, is overlaid and represented by black dashed lines and text [25]
