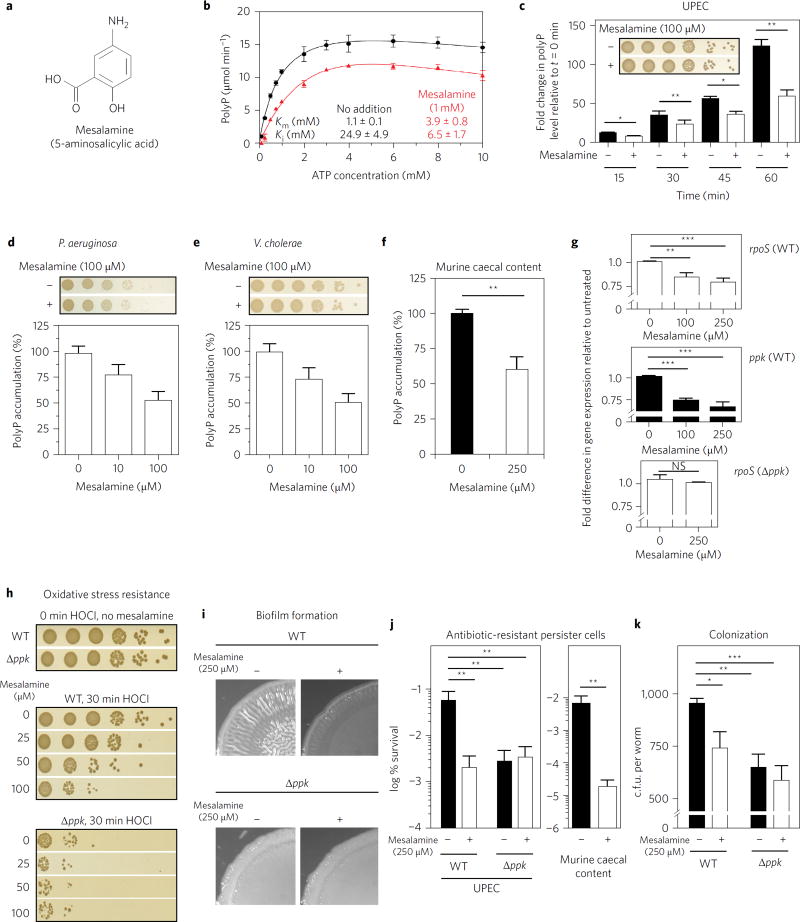
Figure 1. Mesalamine mimics ppk mutant phenotypes.
a, Structure of mesalamine. b, Michaelis–Menten kinetics of E. coli PPK with (red triangles) or without (black circles) 1 mM mesalamine. Data represent the mean ± s.d. c–f, Effect of mesalamine on nutrient-shift-induced polyP accumulation in UPEC (c), P. aeruginosa (d), V. cholera (e), or bacteria cultivated from caecal contents of healthy BL/6 mice (f). In c, *0.01 < P < 0.05, **0.001 < P < 0.01 (unpaired t-test). In d,e, data represent the mean ± s.d. In f, **P = 0.0058 (ratio paired t-test). Insets: bacterial survival was tested 60 min after nutrient shift. g–k, Effect of mesalamine on: expression of rpoS (top) and ppk (middle) in UPEC wild-type cells or rpoS in UPEC ppk− (bottom) 20 min after shift to low phosphate medium (g); oxidative stress resistance of UPEC wild-type and ppk− strains (h); macrocolony biofilm formation of UPEC wild-type and ppk− strains (i); formation of ampicillin-resistant persister cells of UPEC wild-type and ppk− strains or of bacteria cultivated from caecal contents of healthy BL/6 mice (j); and colonization of P. aeruginosa wild-type and ppk− strains in C. elegans (k). In g, NS, P > 0.01, **0.001 < P <0.01, ***0.0001 < P < 0.001 (one-way ANOVA). In j, UPEC: **0.001 < P < 0.01 (two-way ANOVA); murine caecal content: **P = 0.008 (ratio paired t-test). In k, *P < 0.05, **P < 0.01, ***P < 0.001 (two-way ANOVA). All data in bar diagrams represent mean ± s.d. Detailed information about the statistical analyses is provided in the Methods.

