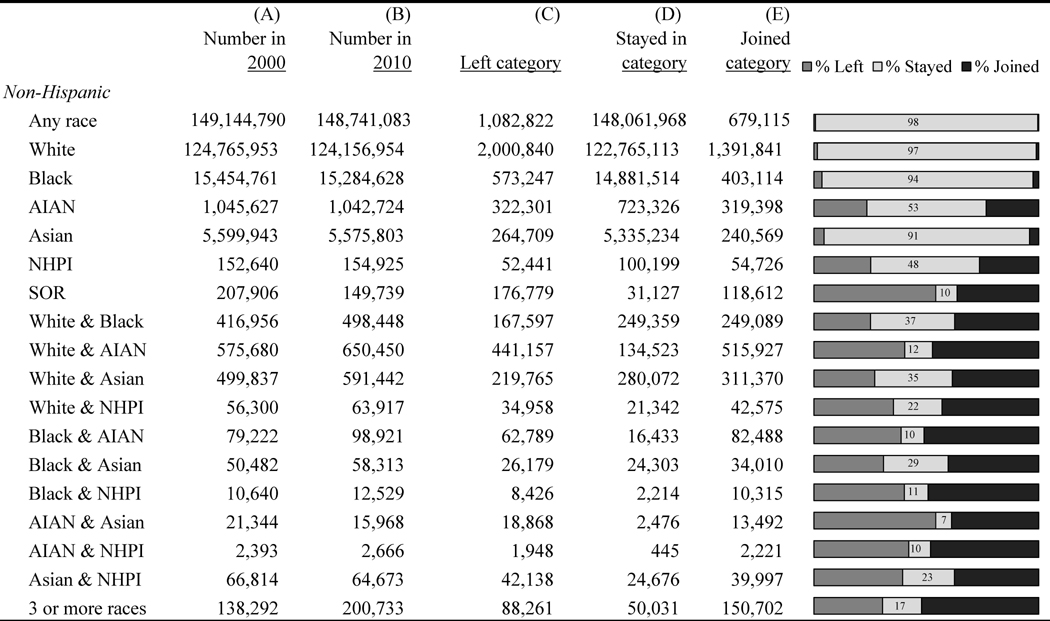
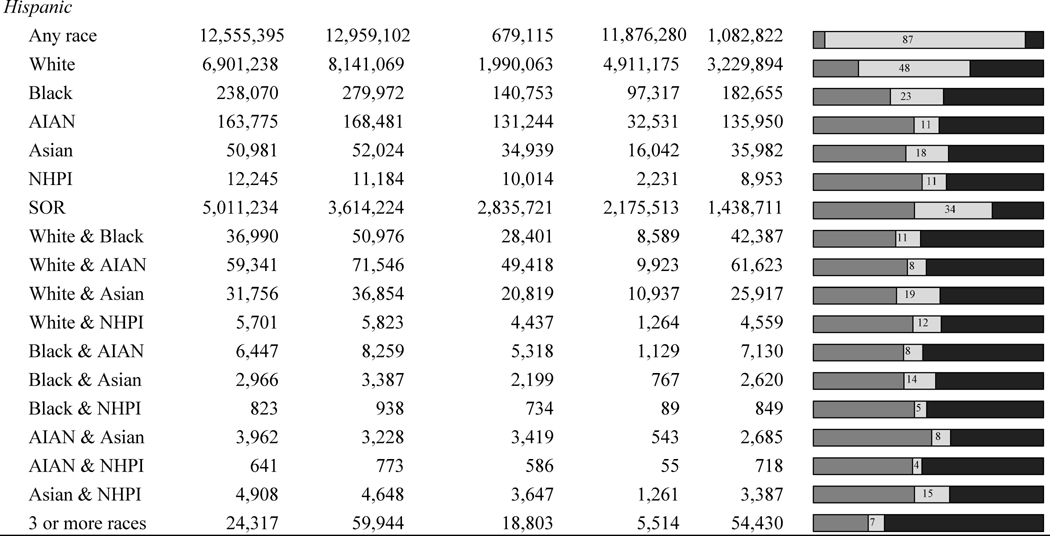
Table 2. Race response fluidity between Census 2000 and the 2010 Census, by Hispanic origin.
Abbreviations: AIAN = American Indian/Alaska Native; NHPI = Native Hawaiian and other Pacific Islander; SOR = Some Other Race.
Notes: Case counts include only people in the linked data. Rows are in census order (U.S. Census Bureau 2007:6–1 to 6–3). Not shown: 135,431 people in the linked data who reported non-Hispanic multiracial including SOR in 2010 and 474,836 people who reported Hispanic multiracial including SOR in 2010. % left = C/(C+D+E); % stayed = D/(C+D+E); % joined = E/(C+D+E). The percent who stayed in the category (shown numerically) represents the percent of people who reported a race and Hispanic origin combination in both 2000 and 2010, of the people who reported that combination in either 2000 or 2010.


