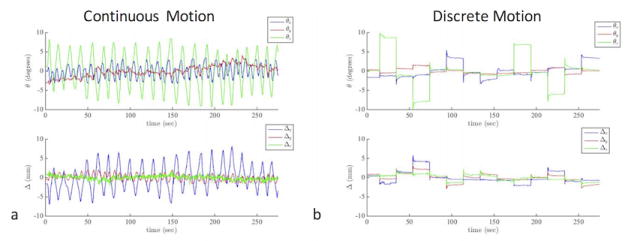
Figure 4.

Plots of the three rotation and three translation parameters measured using the optical tracking system during the “optical correction” experiments shown in Figs. 2d,h and Fig. 3d,h. In order to provide a better visualization of the motion plots, the average of each rotation and translation plot is subtracted so that the motion plots are centered around 0.
