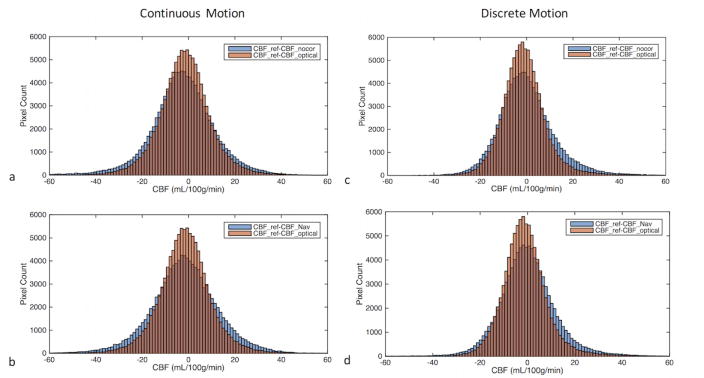
Figure 6.

Histogram of pixel-wise differences between reference CBF and the CBF obtained from three motion experiments (i.e., non-corrected, corrected using navigator-style updates and corrected using continuous optical updates) in the presence of continuous (a,b) and discrete (c,d) motion. In order to make comparison easier, the histogram difference between CBF values obtained from the experiment with optical correction and reference (CBF_ref-CBF_optical) is plotted on the same graph with the other two CBF difference histograms (i.e., CBF_ref-CBF_nocor and CBF_ref-CBF_Nav). The intersections of the histograms are shown with a darker color. It can be seen that CBF_ref-CBF_optical histogram has a more peaked distribution than CBF_ref-CBF_nocor (a,c) or CBF_ref-CBF_Nav (b,d), implying CBF_optical values are closer to CBF_ref compared to the other two methods.
