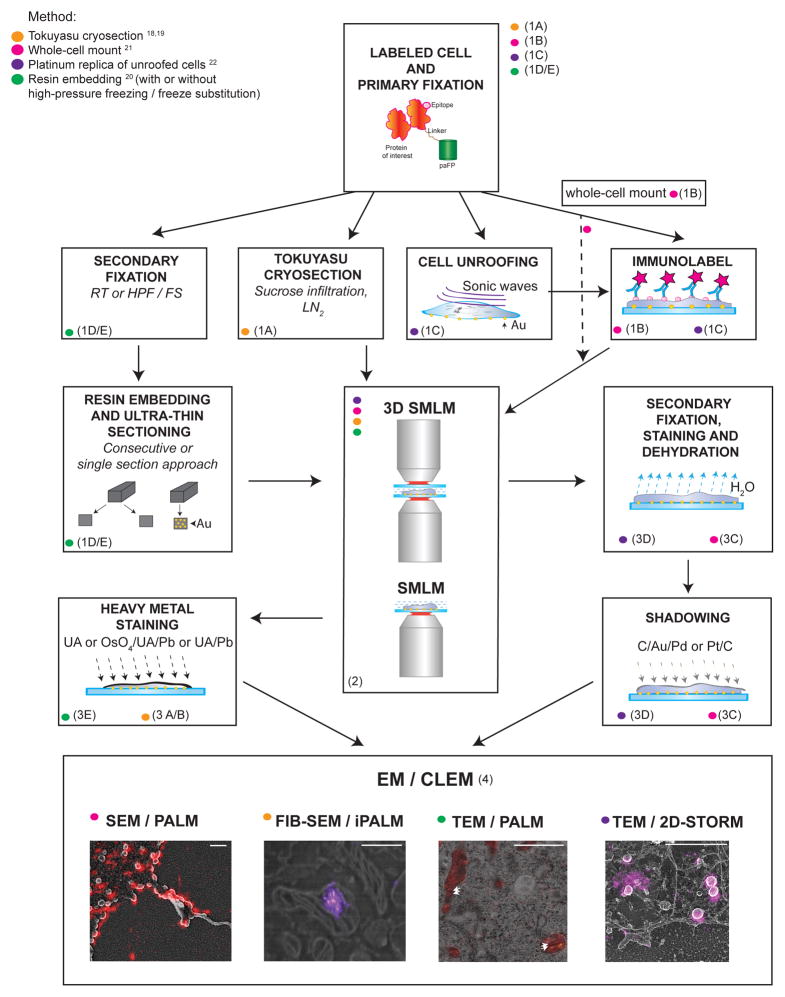
Figure 1.
Flowchart of the protocols featured in this paper. See text and Table 1 for the details, advantages and limitations, and anticipated results for each procedure. Scale bars = 500 nm. FIB-SEM/iPALM image in bottom panel is reproduced from19. Arrows in TEM/PALM image indicate the locations of mitochondrial cristae. Images further discussed in Figure 6. Au, gold; C, carbon; HPF/FS, high-pressure freezing/freeze substitution; LN2, liquid nitrogen; OsO4, osmium tetroxide; Pb, lead; Pd, palladium; Pt, platinum; UA, uranyl acetate.

